Entry
First, congratulations on making it to the final chapter. The reason "Entry" is placed at the end is that you should already be fully familiar with all ICT/SMC concepts before you have enough theoretical foundation to support your entries. Blindly copying entry models mechanically will only get you punished by the market. In reality, all ICT/SMC entry models are just combinations of the concepts discussed in the previous chapters. If you understand the previous material well enough, you may not even need to read this chapter.
Setup
Before applying an entry model, you need to complete the following steps:
- Establish your Bias. You need to know whether you are bullish or bearish. You must approach the market with a clear Bias, and that Bias may come from data, news, ERL & IRL, and so on.
- On the HTF, identify your Point of Interest (POI). It may be a specific PDA on the higher timeframe.
- Wait for a liquidity raid on the MTF that also enters the HTF POI you identified, meaning Liquidity Sweep into HTF POI. When price creates a false breakout but does not enter the HTF POI, you should not try to trade it. You should think carefully about whether the current price action is a liquidity sweep or a real breakout.
- On the MTF, define IRL & ERL. At this point, you should have a clear DOL, meaning the area where you believe price should go.
- Move into the LTF. Based on the IRL & ERL you just identified, define a clear MMXM and Dealing Range. Know exactly which part of MMXM you are in, while observing more detailed price action to strengthen your Bias as much as possible.
- If you are bullish, look for entries in Discount. If you are bearish, look for entries in Premium.
- Make sure you are taking a trade with a high risk-to-reward ratio, at least greater than 1R, and then enter.
The chart below is a recent BTC short setup I took, which I will use as an example:
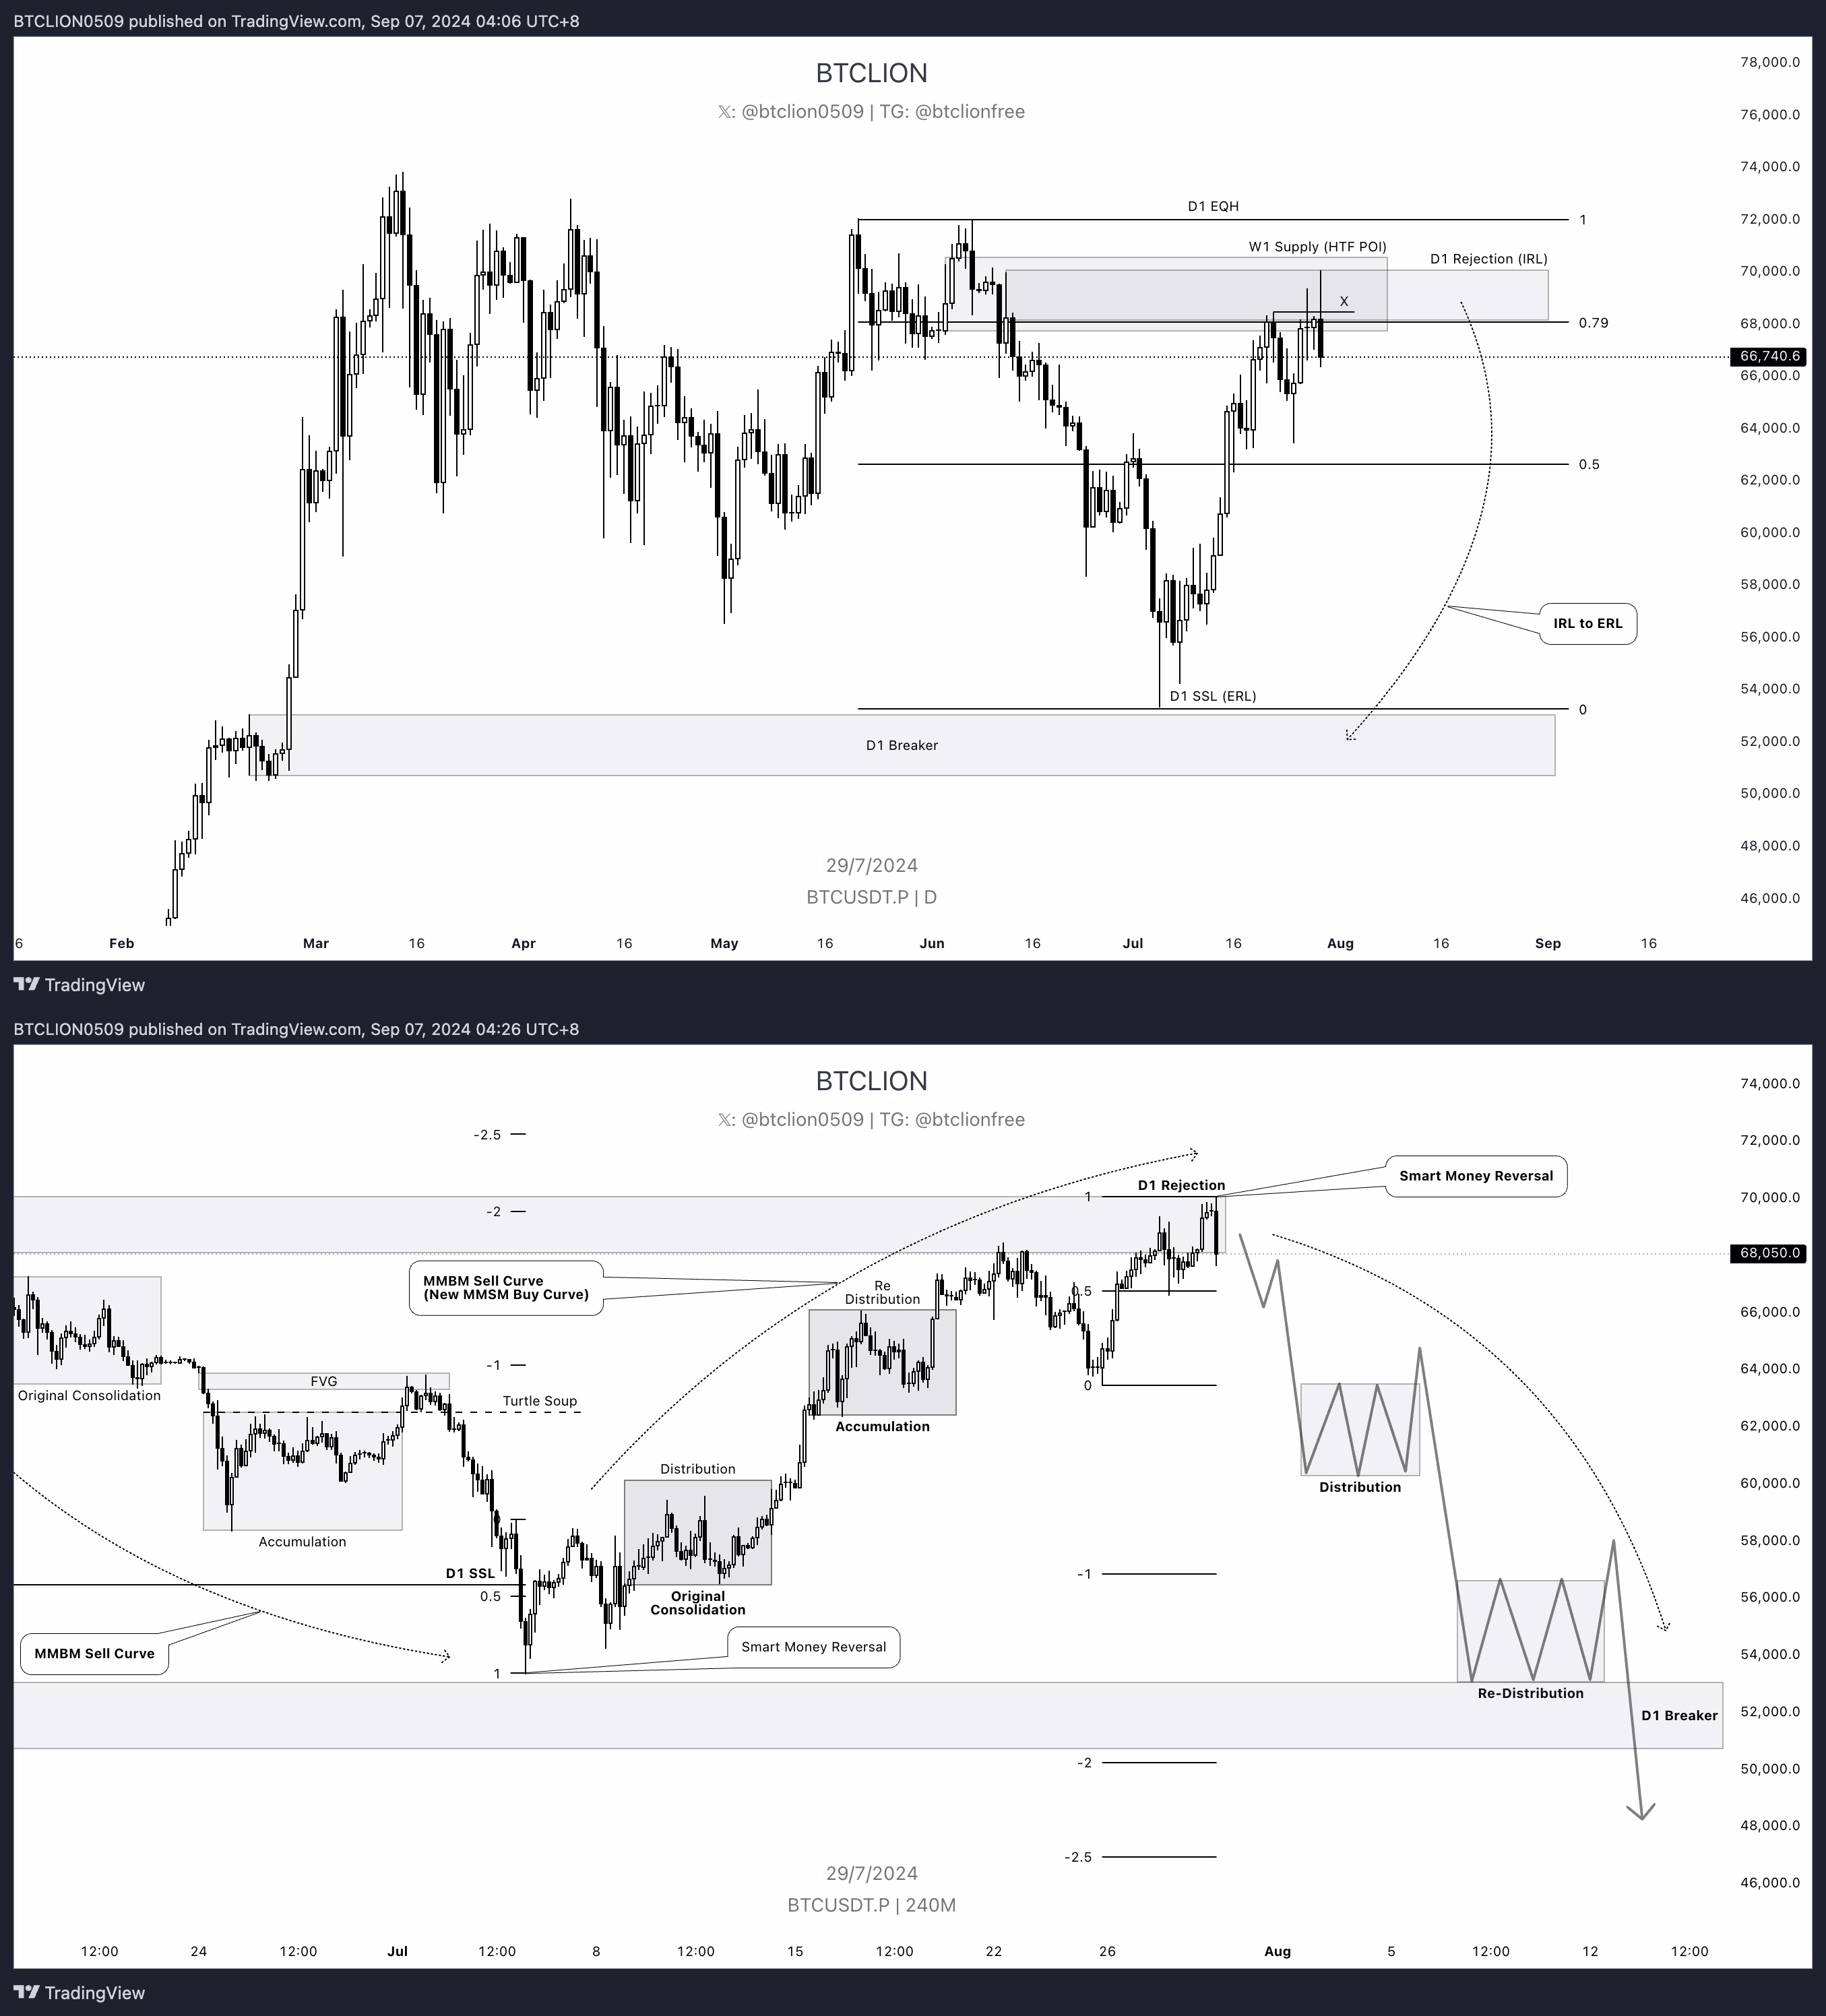
- HTF Bias: on the daily chart, price produced a Liquidity Sweep, entered a bearish weekly order block, and showed strong rejection. This area also happened to be inside the Dealing Range OTE, with the candle closing perfectly inside OTE. Therefore, we established a clear bearish Bias and used the weekly order block as our HTF POI.
Because we mainly used the weekly order block to build Bias, I wanted this to be a Swing Trade. I wanted to get Bias from the weekly chart, find IRL & ERL on the daily chart to obtain DOL, and finally enter on the four-hour chart.
-
Liquidity Sweep into HTF POI: on the daily chart, we observed price performing a Liquidity Sweep and entering our weekly order block, which was the HTF POI.
-
MTF IRL to ERL: on the daily chart, we can see that after price entered our HTF POI, it respected the area strongly. At the same time, there was a long upper-wick order block on the left side of the chart. We could treat this upper wick as an important IRL. After price respected IRL, the next step should be price delivery toward ERL.
-
DOL: at this point on the chart, we could clearly treat the daily SSL as an important MTF ERL. We believed it would be raided during the IRL to ERL price delivery, while price would enter another HTF POI during the raid. Since the weekly chart was still in a clear bullish market structure, I chose the nearest PDA more conservatively, which was the daily Breaker, as my DOL.
-
LTF MMXM: on the four-hour chart, after drawing STDV, we could clearly see that price was at the end of the old MMBM and the beginning of a new MMSM. Price first formed a Sell Curve, then after taking the daily SSL, it created a Smart Money Reversal and formed a Buy Curve, reaching the daily Rejection Block. The thin labels mark the old MMBM, and the bold labels mark the new MMSM. Price was preparing for a new Smart Money Reversal.
-
At the same time, we could see that when price entered the STDV 2.0-2.5 area, the price action was an upward HRLR. This strengthened our bearish Bias. We expected the liquidity created by this HRLR to later become the fuel for a downside LRLR.
-
After drawing a new STDV, I chose not to return to the MTF to look for PDAs inside the 2.0-2.5 area. To stay conservative, I used the daily Breaker we had already identified as the take-profit target.
-
After the four-hour candle closed below the daily Rejection Block, we could see that price formed a BPR on the four-hour chart. This indicated that the liquidity above was balanced, and price had no reason to move back up and test the BPR. Even if price did return, it should reject quickly. In addition, the bullish FVG being engulfed was also a poor sign for bulls. All of these factors strengthened our bearish Bias.
-
Entry: based on the above, this formed my short setup, and I chose to enter here.
- Entry: 68050 (H4 Turtle Soup)
- Take-profit: 52500 (D1 Breaker).
- Stop-loss: 72300 (above the previous MMBM's STDV 2.5).
At this point, we had a trade with a 3.66R risk-to-reward ratio. That is an acceptable number, so the trade was worth taking decisively. Afterward, price successfully reached the take-profit target, making it a solid trade.
Entry Model
After the previous seven chapters, you should already have learned many things. But in practice, you may still not know how to enter. The so-called "entry model" teaches you how to build your own entry setup. Of course, you can copy the entry models given here directly into live trading, but you still need to understand why the model is built this way. Once you understand entry models, your trading will not need to rely on them.
An entry model should include the following steps:
- Liquidity sweep
- Price action that confirms reversal (MSS/CISD)
- Retracement into a PDA and entry when price respects it
Generally speaking, ICT entry models limit the trading time, usually requiring entries during London or New York Killzone. However, as I mentioned earlier, crypto's timezone behavior is extremely messy. Based on my experience, as long as liquidity is sufficient, trading is feasible.
There are many types of entry models. Here, I will simply list a few so you can understand what an entry model looks like. If you want to learn more, you can ask in the community.
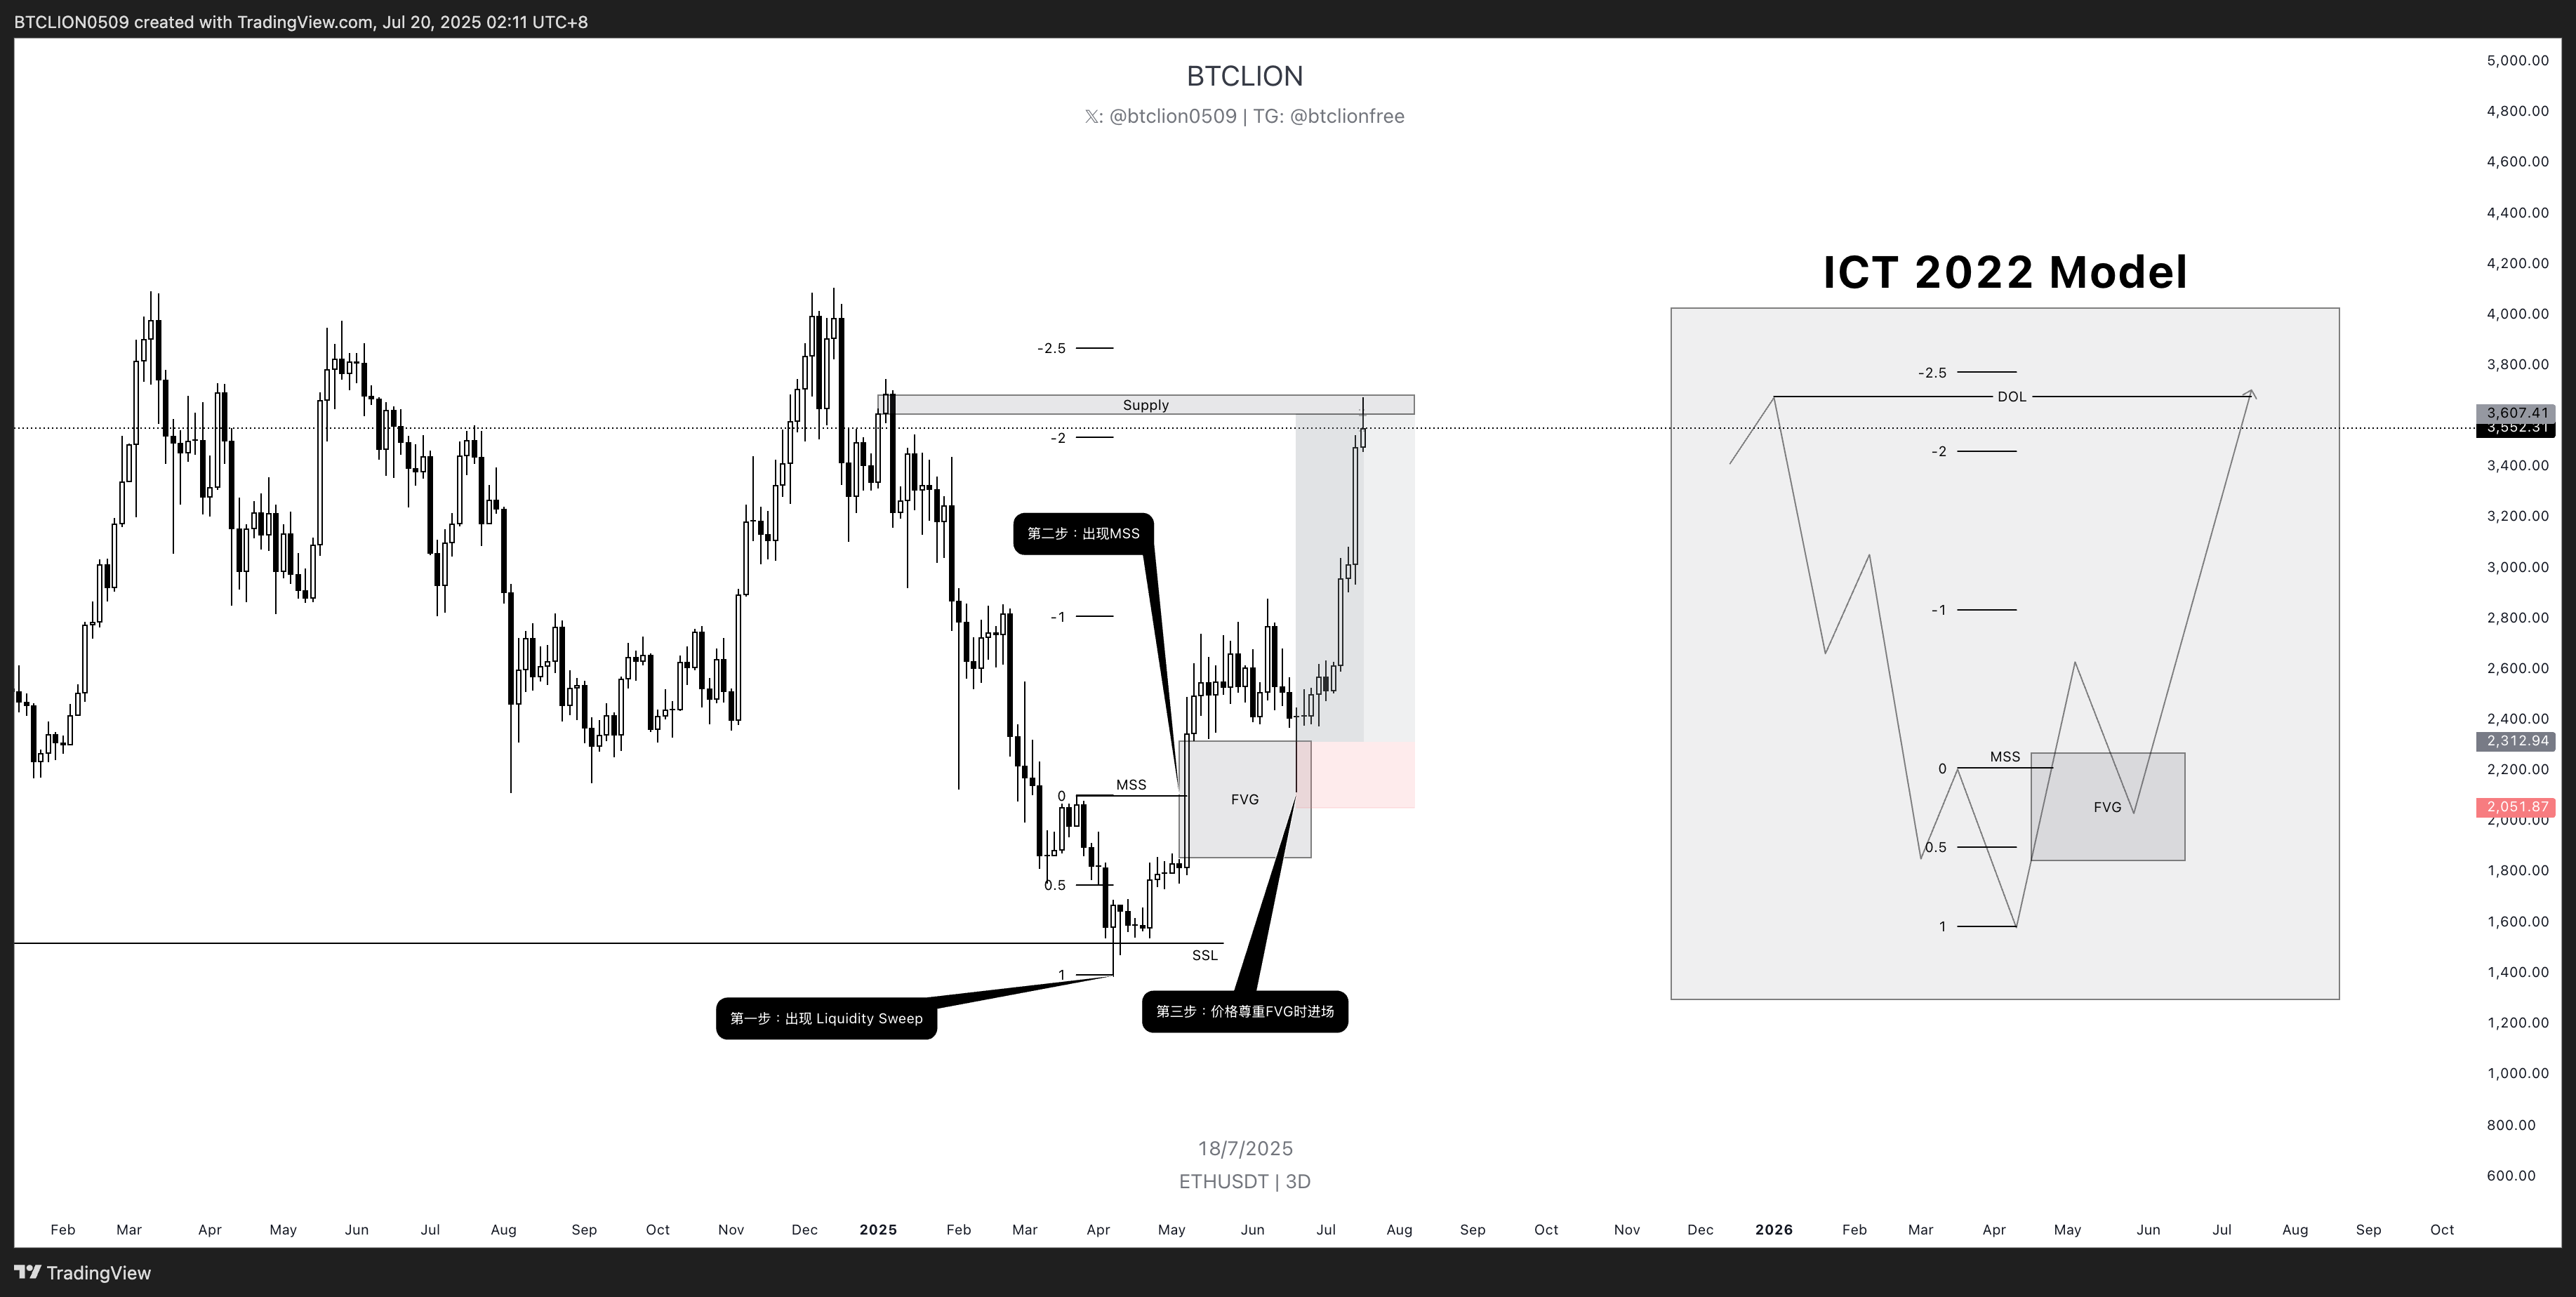
ICT 2022 Model
This is the most classic entry model. According to ICT himself, this is the model he gave to his daughter, and everyone can use it to achieve financial freedom within 90 days. Here, I am only responsible for introducing the model. Whether or not it really gives you freedom is something you can experience for yourself.
Setup
- Liquidity sweep
- MSS
- Enter when price respects the FVG
- Place the stop-loss below the low of the Liquidity Sweep, or use a more aggressive stop directly below the FVG or below the low created when price retraces into the FVG
- Set take-profit at your DOL, which can be obtained through STDV or any PDA where you believe price should go
Silver Bullet Model
This is basically the same as the 2022 Model, except it adds strict time restrictions. The Silver Bullet Model limits trades to the following three windows:
-
New York AM: 10:00 PM ~ 11:00 PM Taipei time
-
New York PM: 02:00 AM ~ 03:00 AM Taipei time
-
London Open: 03:00 PM ~ 04:00 PM Taipei time
The times above are based on daylight saving time. During standard time, shift them one hour later. The Silver Bullet Model also limits the trading timeframe to below M15, usually M5 to M1.
In fact, most ICT entry models recommend executing trades inside killzones. The Silver Bullet Model is just stricter.
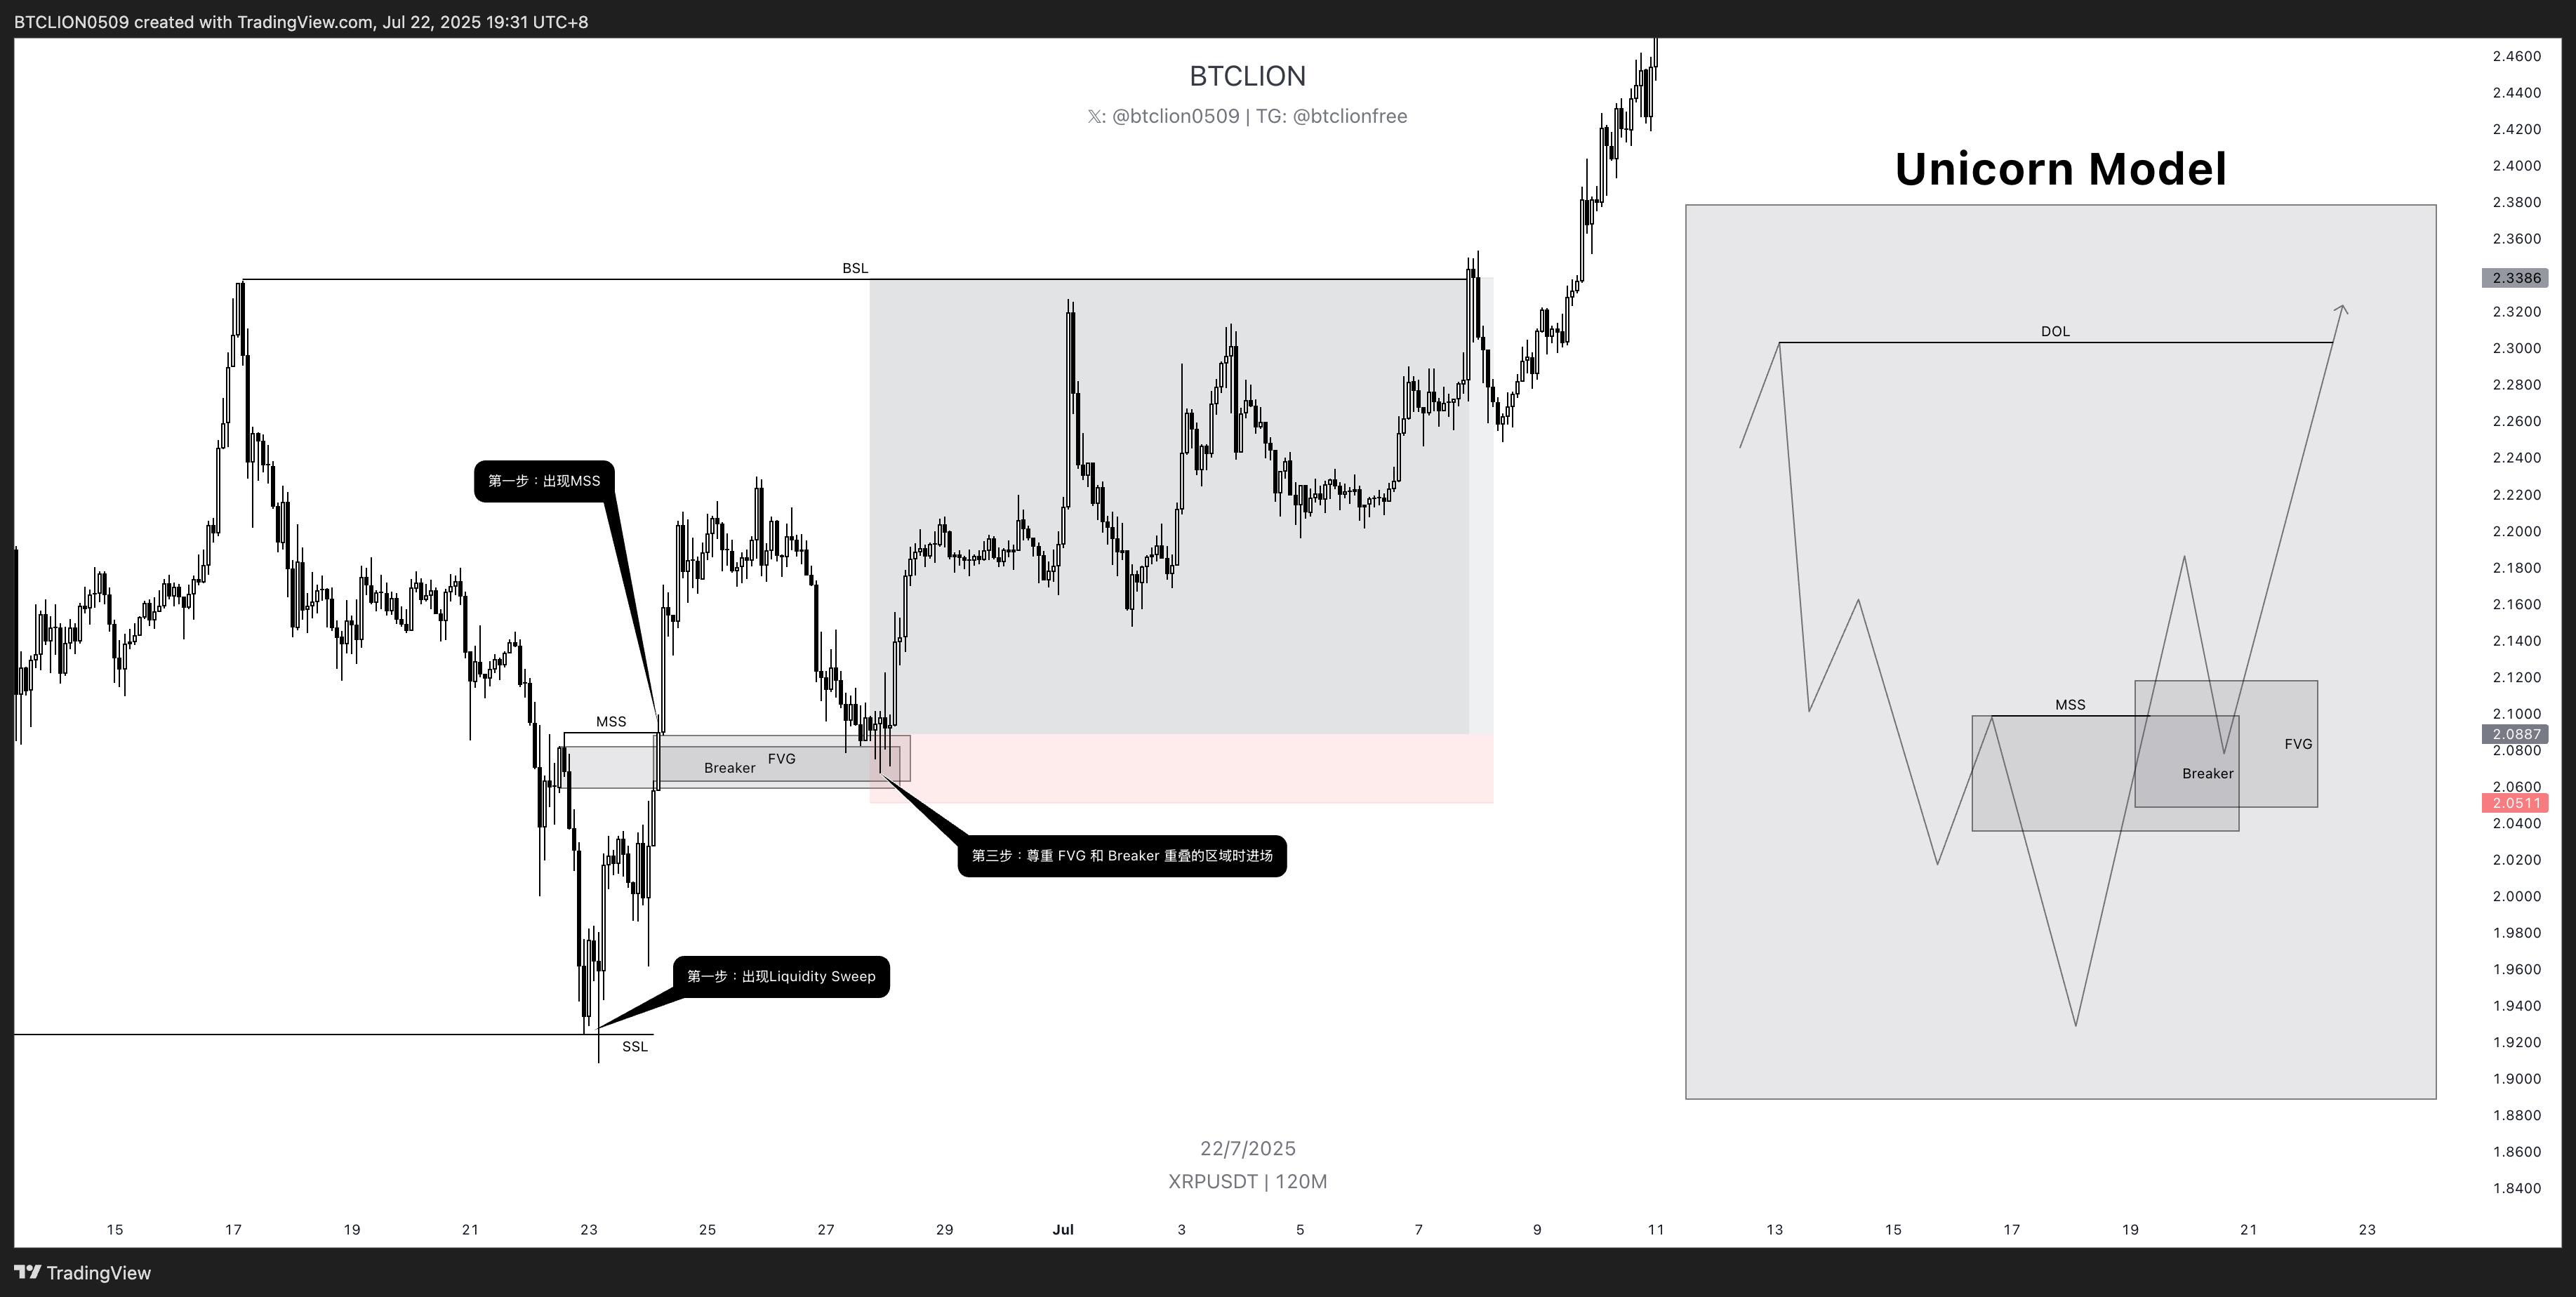
Unicorn Model
This is similar to the 2022 Model, except it adds a breaker to the entry.
Setup
- Liquidity sweep
- MSS
- Enter when price respects the area where FVG and Breaker overlap
- Place the stop-loss below the low of the Liquidity Sweep, or use a more aggressive stop directly below the FVG or below the low created when price retraces into the FVG + Breaker
- Set take-profit at your DOL, which can be obtained through STDV or any PDA where you believe price should go to
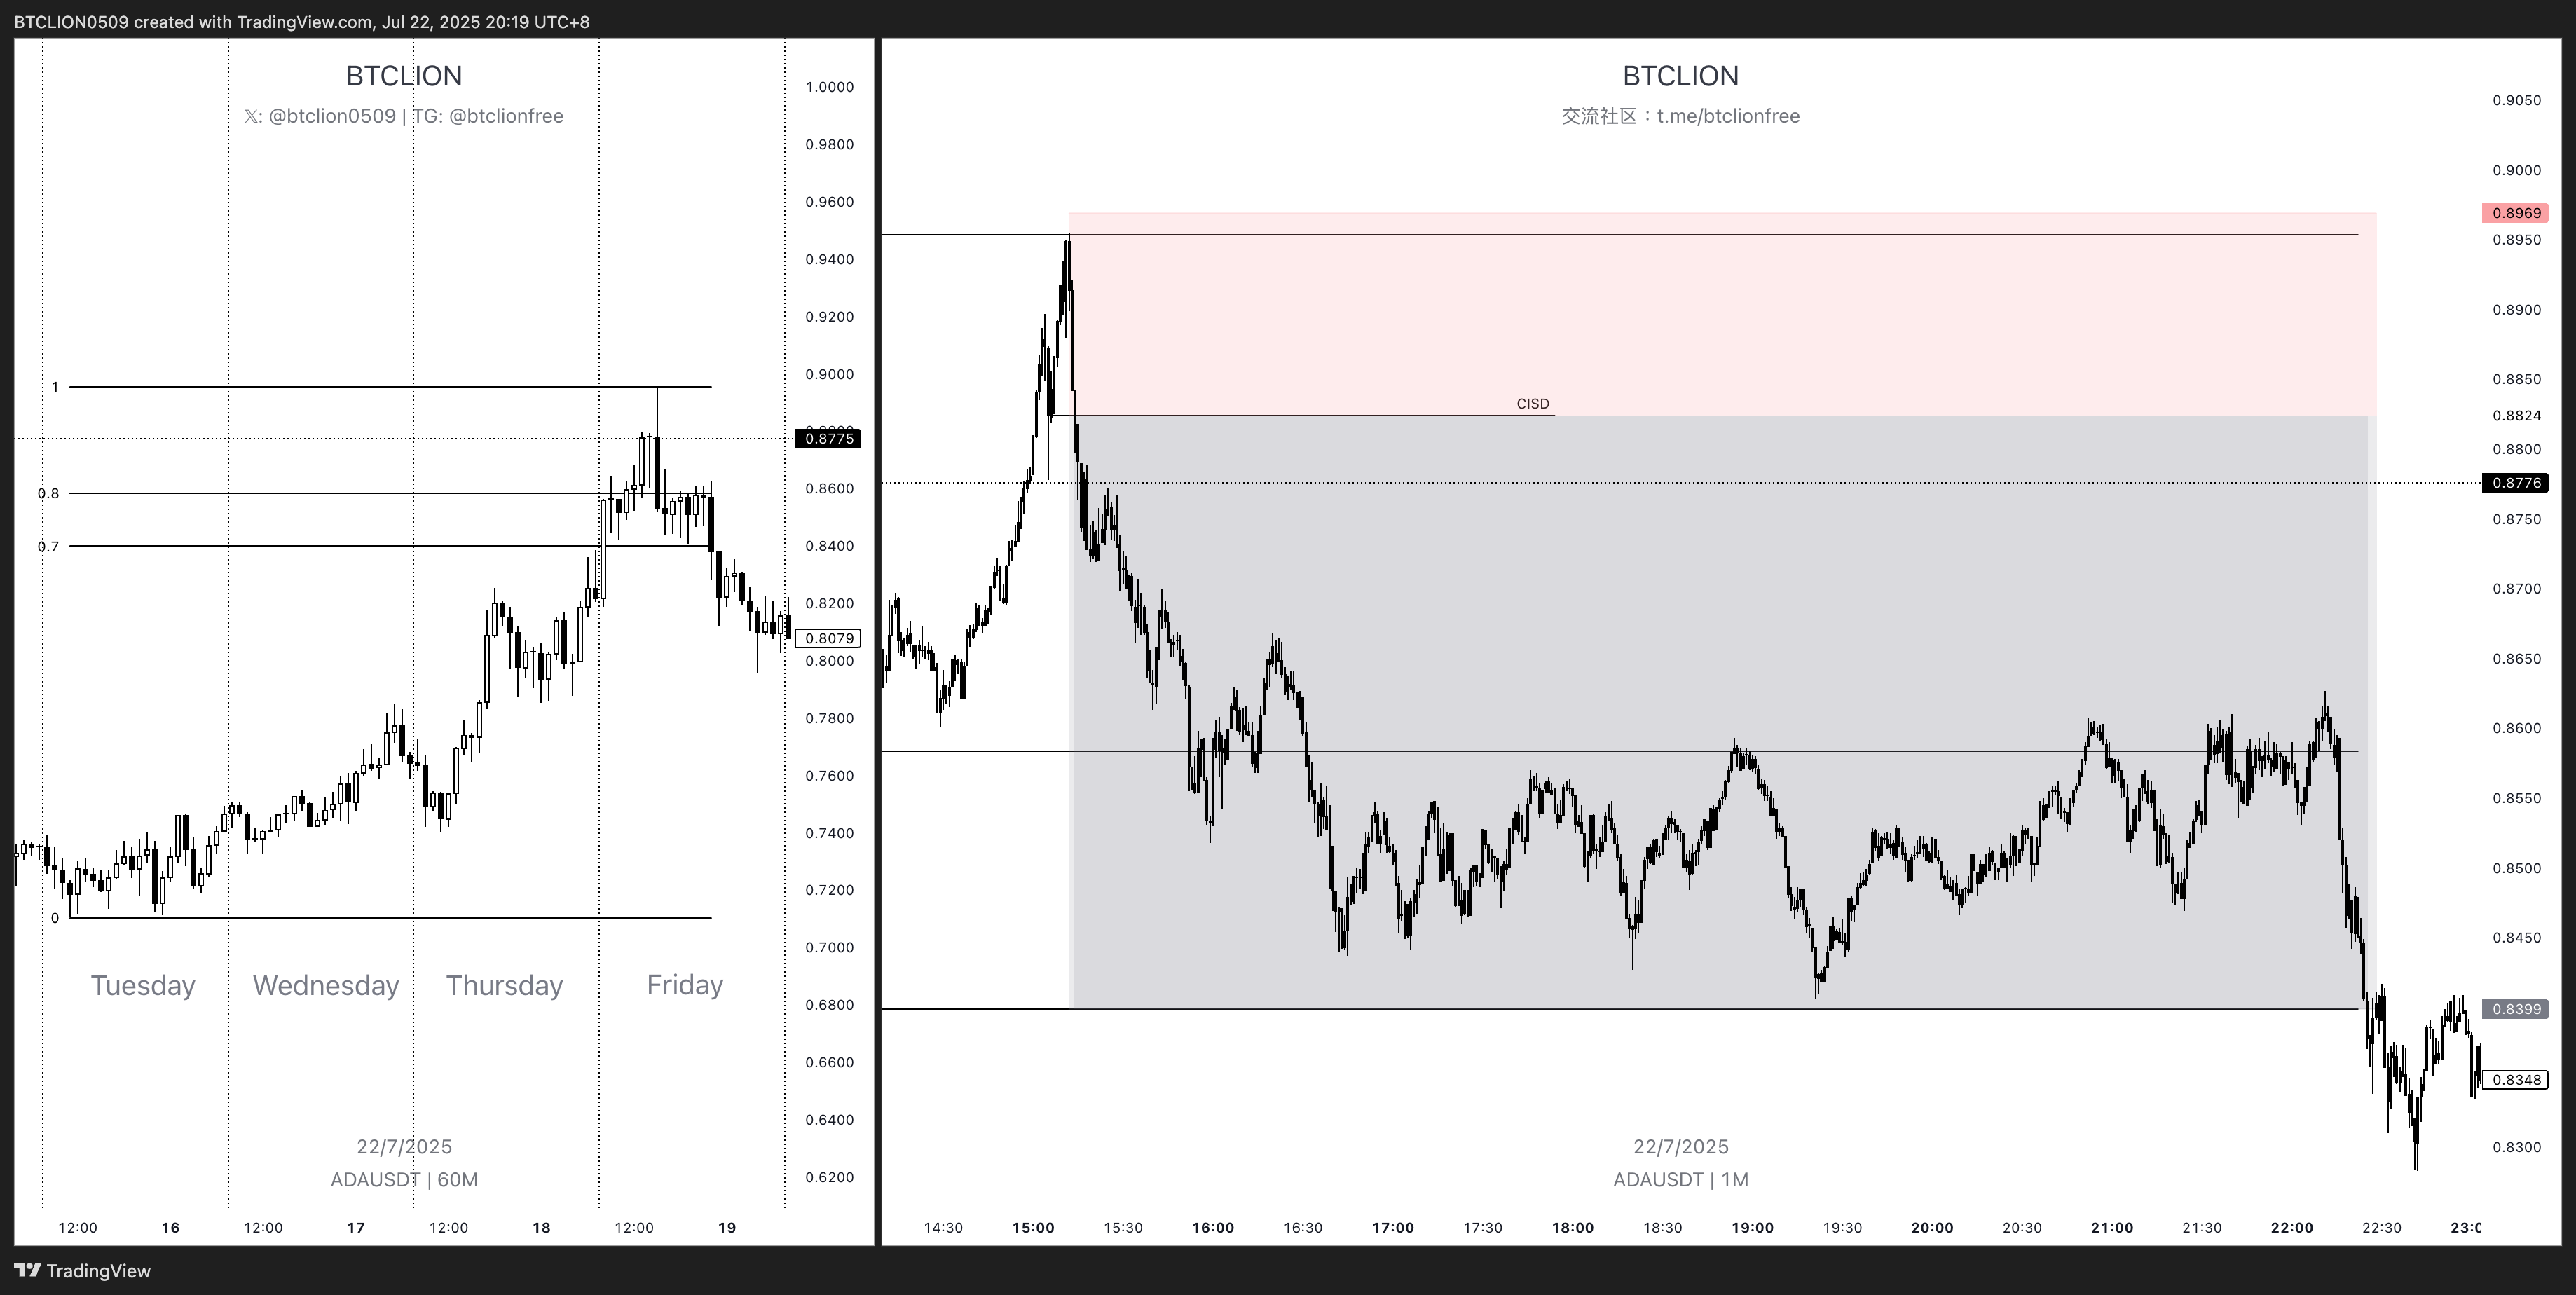
TGIF Model
TGIF means "Thank God It's Friday." This is also a Friday-specific trading model. The logic is that after the market has rallied or sold off significantly during the week, it often retraces 20-30% of the weekly range on Friday. To use this model, the following conditions are required:
- Trade on Friday.
- The opposite extreme of the week must have formed on Monday or Tuesday. If the week has been bullish, the weekly low should have formed on Monday or Tuesday, and vice versa.
- The daily candles on Tuesday, Wednesday, and Thursday should close in the same direction three days in a row. If the week has been bullish, then Tuesday, Wednesday, and Thursday should all close as bullish candles.
- On the lower timeframe, usually below M15, wait for reversal price action such as MSS or CISD, then wait for price to retrace into the PDA you are interested in before entering. If you want to be more aggressive, you can also enter without waiting for the retracement.
- Take-profit is 20-30% of the weekly range. Stop-loss is handled the same way as mentioned in the 2022 Model, depending on how aggressive you want to be.