Advanced Market Structure
This chapter may feel more technical. Many of the concepts discussed here do not have a fixed visual form on the chart, but please make the effort to understand them. I consider this chapter the essence of ICT/SMC. Once you fully understand it, you will have a much deeper understanding of market structure and price delivery.
Top-Down Analysis
When we focus on intraday trading, we often spend most of our attention on the fifteen-minute chart (M15). But if we want a broader view of price action, focusing only on M15 is not enough. We need to move up to a higher timeframe chart, such as the four-hour chart. If we want to read more detailed price action, M15 may also be insufficient, so we move down to a lower timeframe chart, such as the one-minute chart. ICT/SMC defines the relationship between different timeframes and standardizes which higher-timeframe and lower-timeframe charts correspond to each trading style, as well as what you should focus on at each timeframe.
Terminology:
- M15: the "M" stands for "Minute," so "M15" means a fifteen-minute chart. We usually use a "letter + number" format to abbreviate timeframes. For example, "H4" means four-hour, and "W1" means weekly.
- LTF/MTF/HTF: Low Time Frame / Middle Time Frame / High Time Frame
Time Frame Alignment
| HTF | MTF | LTF | |
|---|---|---|---|
| Position Trading | Monthly | W1 | D1 |
| Swing Trading | W1 | D1 | H4 |
| Intraday Trading | D1 | H4 | M15 |
| Scalping Trade | H4 | M15 | M1 |
- HTF: you should read market structure here, use ERL/IRL to find your DOL, and establish your Bias.
- MTF: you should look for trade opportunities here.
- LTF: you should refine your entry here.
In reality, the relationship between high, middle, and low timeframes is not defined this rigidly. If you like, you can look for trades on H1 and enter on M3, but this must be built on a solid understanding of how timeframes relate to one another. If you do not have a clear understanding of timeframe, follow the table above and do not do something reckless like finding Bias on the monthly chart and then jumping straight to the one-minute chart for entry.
Power of Three (PO3)
Structure
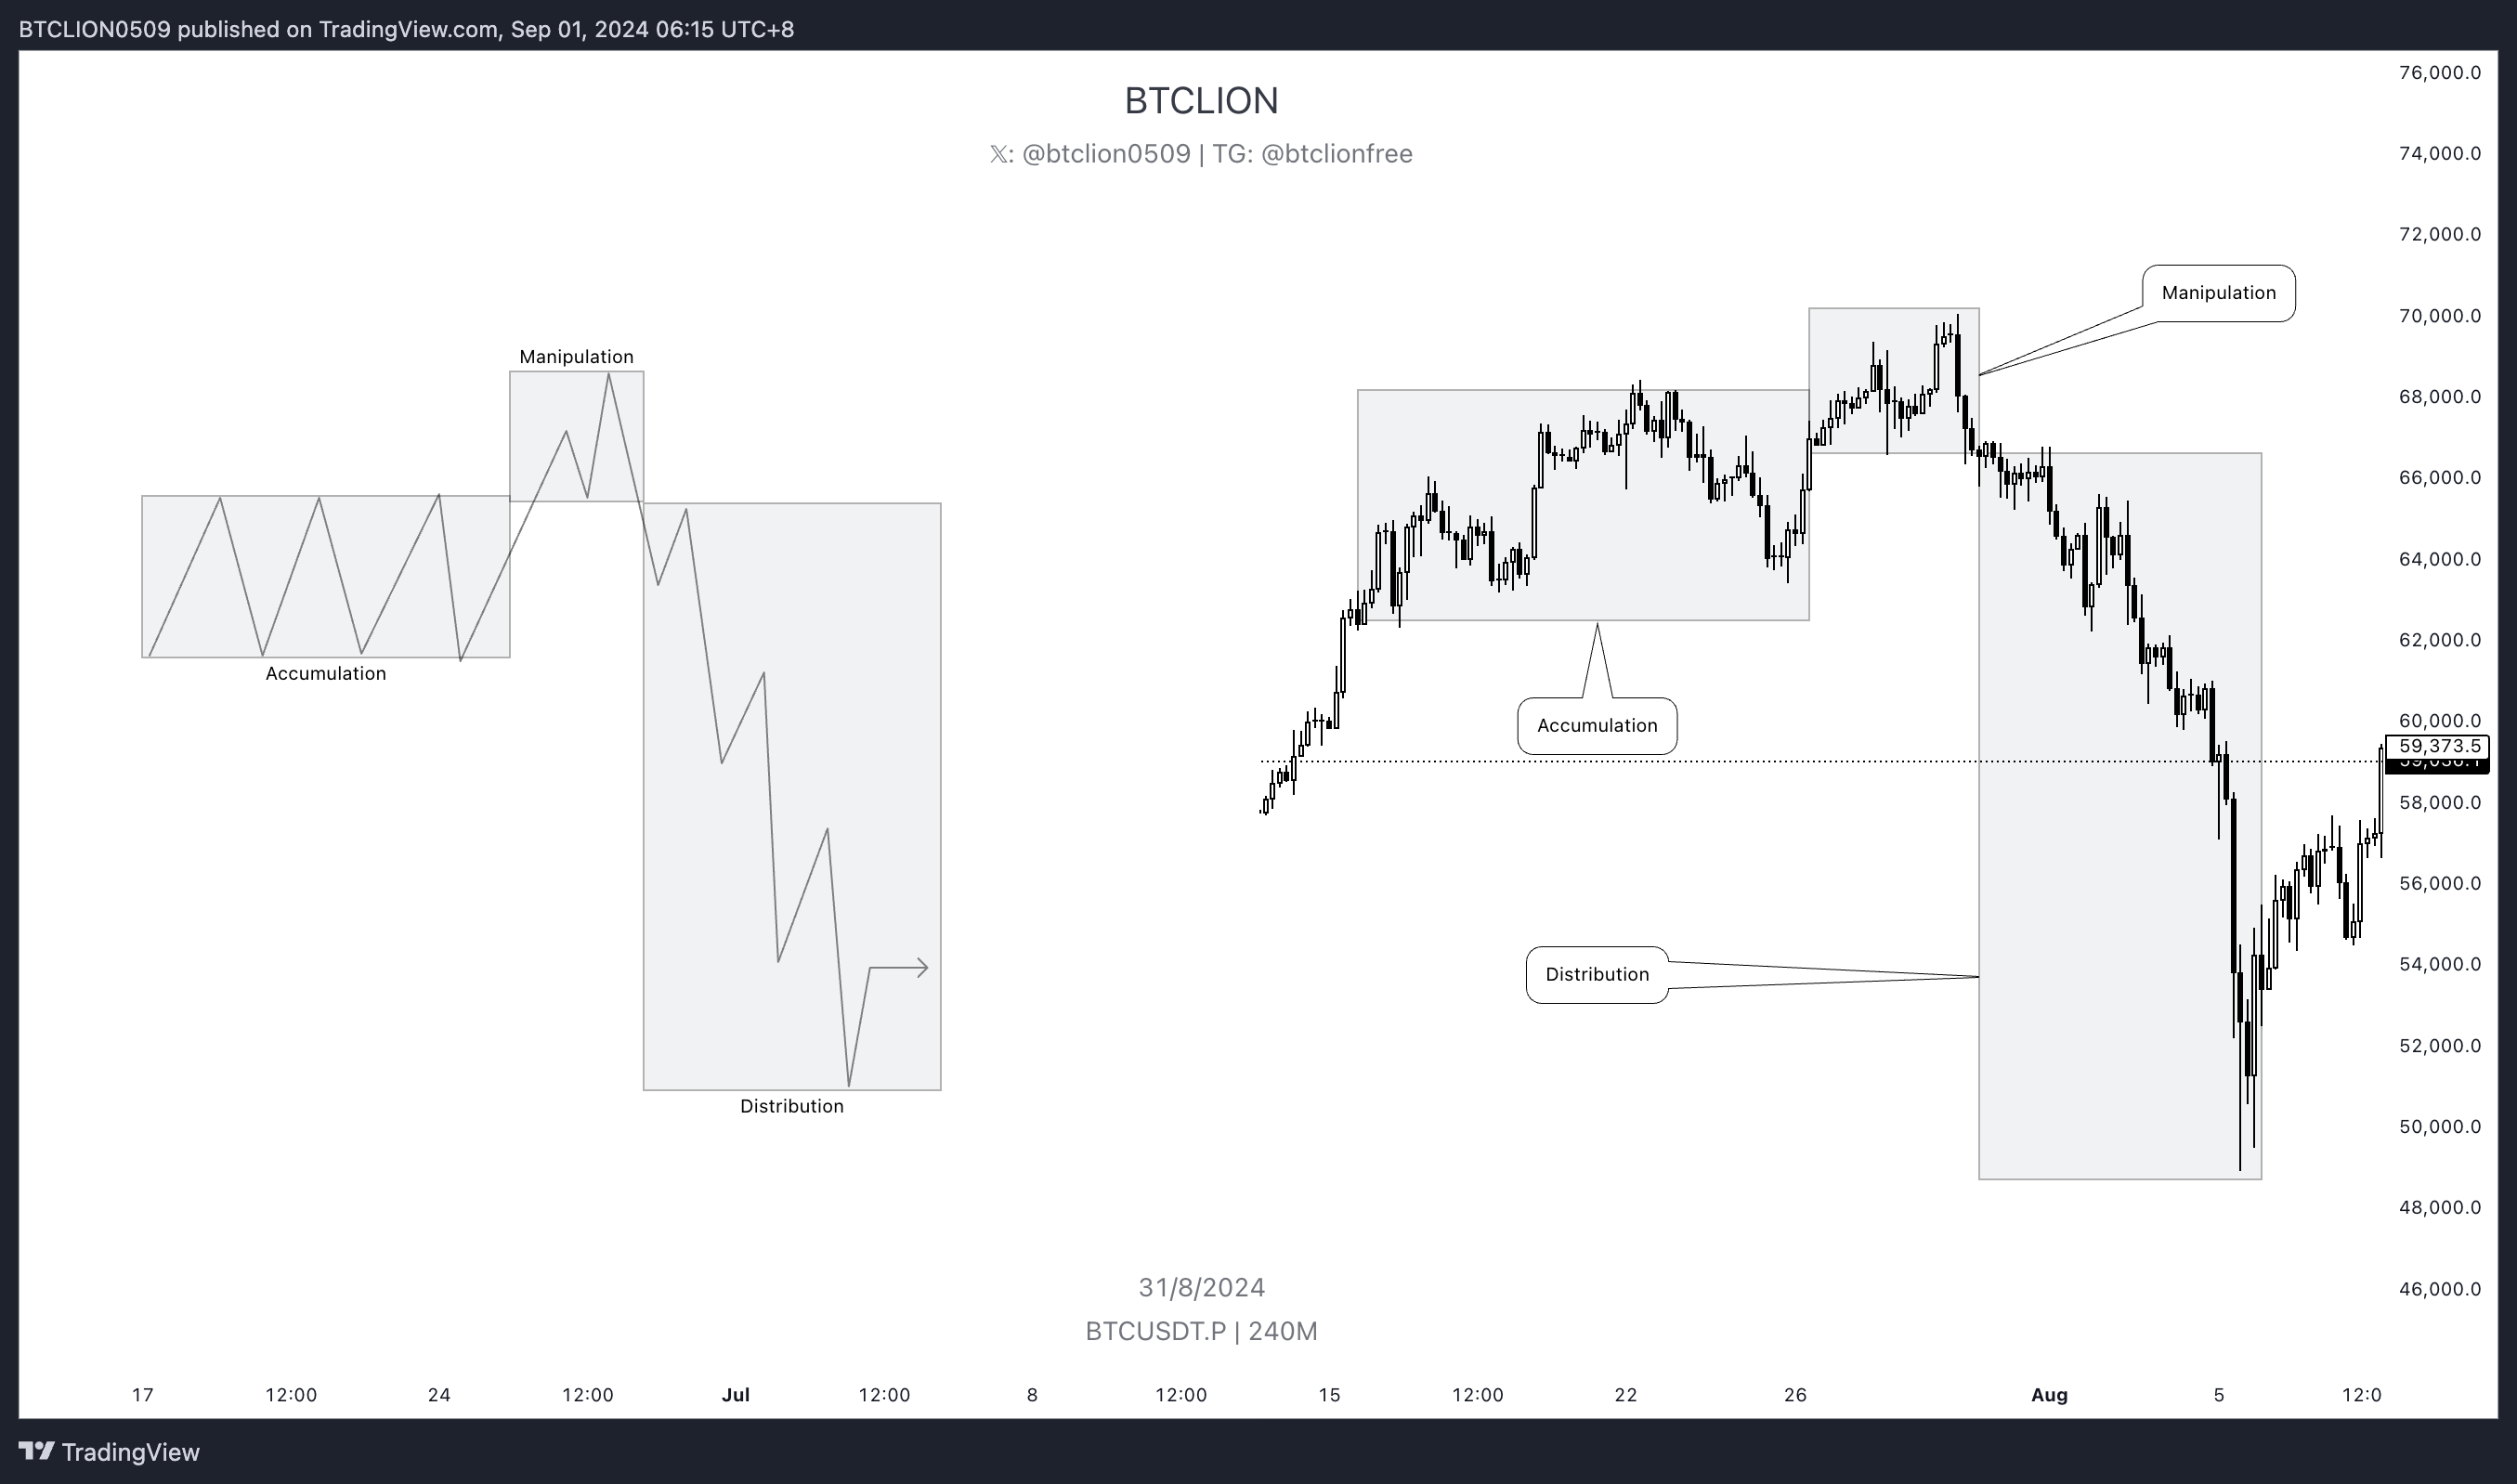
PO3 is one of the core ideas in ICT/SMC. In essence, every trade you take using ICT/SMC is based on PO3. If you asked me what the most important concept in ICT/SMC is, my answer would be PO3. PO3 refers to a specific pattern of price movement and is mainly divided into the following three phases:
- Accumulation Phase: the market enters a consolidation-like phase, where Smart Money begins accumulating inventory around a specific price area, not necessarily a clearly defined range. Price action tends to be stable here and may create clear Swing Points or Liquidity.
- Manipulation Phase: after the Accumulation Phase ends, Smart Money manipulates the market in the opposite direction as a fake move, raiding the Swing Points or Liquidity established during the Accumulation Phase. This is the same idea as the liquidity raid discussed in Chapter 1. The purpose of this phase is to lure speculative traders into chasing the move so Smart Money can complete Order Pairing.
- Distribution Phase: after the raid is complete, price rapidly delivers in the true direction. This usually comes with a clear Liquidity Run or Expansion, and deliver price into DOL eventually.
- Anywhere a liquidity raid exists is essentially PO3. As long as your trade is related to a liquidity raid, you are trading a PO3, or in other words, you are expecting the market to form a complete PO3.
- You want to enter after the market completes Manipulation and exit when Distribution completes.
- When price sweeps a level and quickly reclaims the level, that behavior is also called Turtle Soup. Entering directly after the liquidity sweep and reclaim is called a Turtle Soup Entry.
- The swing that consumes liquidity is called the Manipulation Leg.
- When trading PO3, you want the Manipulation on the current timeframe to enter an HTF DOL. From another angle, the current timeframe's Liquidity Sweep into DOL should appear as a PO3 on the LTF. This is the most important checkpoint before entry, and every entry must be paired with DOL.
Standard Deviation (STDV)
- Standard Deviation (STDV) is a common ICT tool used to assist entries. It cannot be used on its own and must be combined with the concepts and elements discussed earlier.
- STDV can also help you find exit targets, but again, all of this must be combined with PO3, DOL, PDA, and the other concepts discussed earlier.
- Finally, remember not to use STDV outside the context of the other concepts. It is only an auxiliary tool.
Using STDV on the Manipulation Leg can help us identify the target price of a PO3 expansion. The following chart shows how STDV can assist PO3 trading.
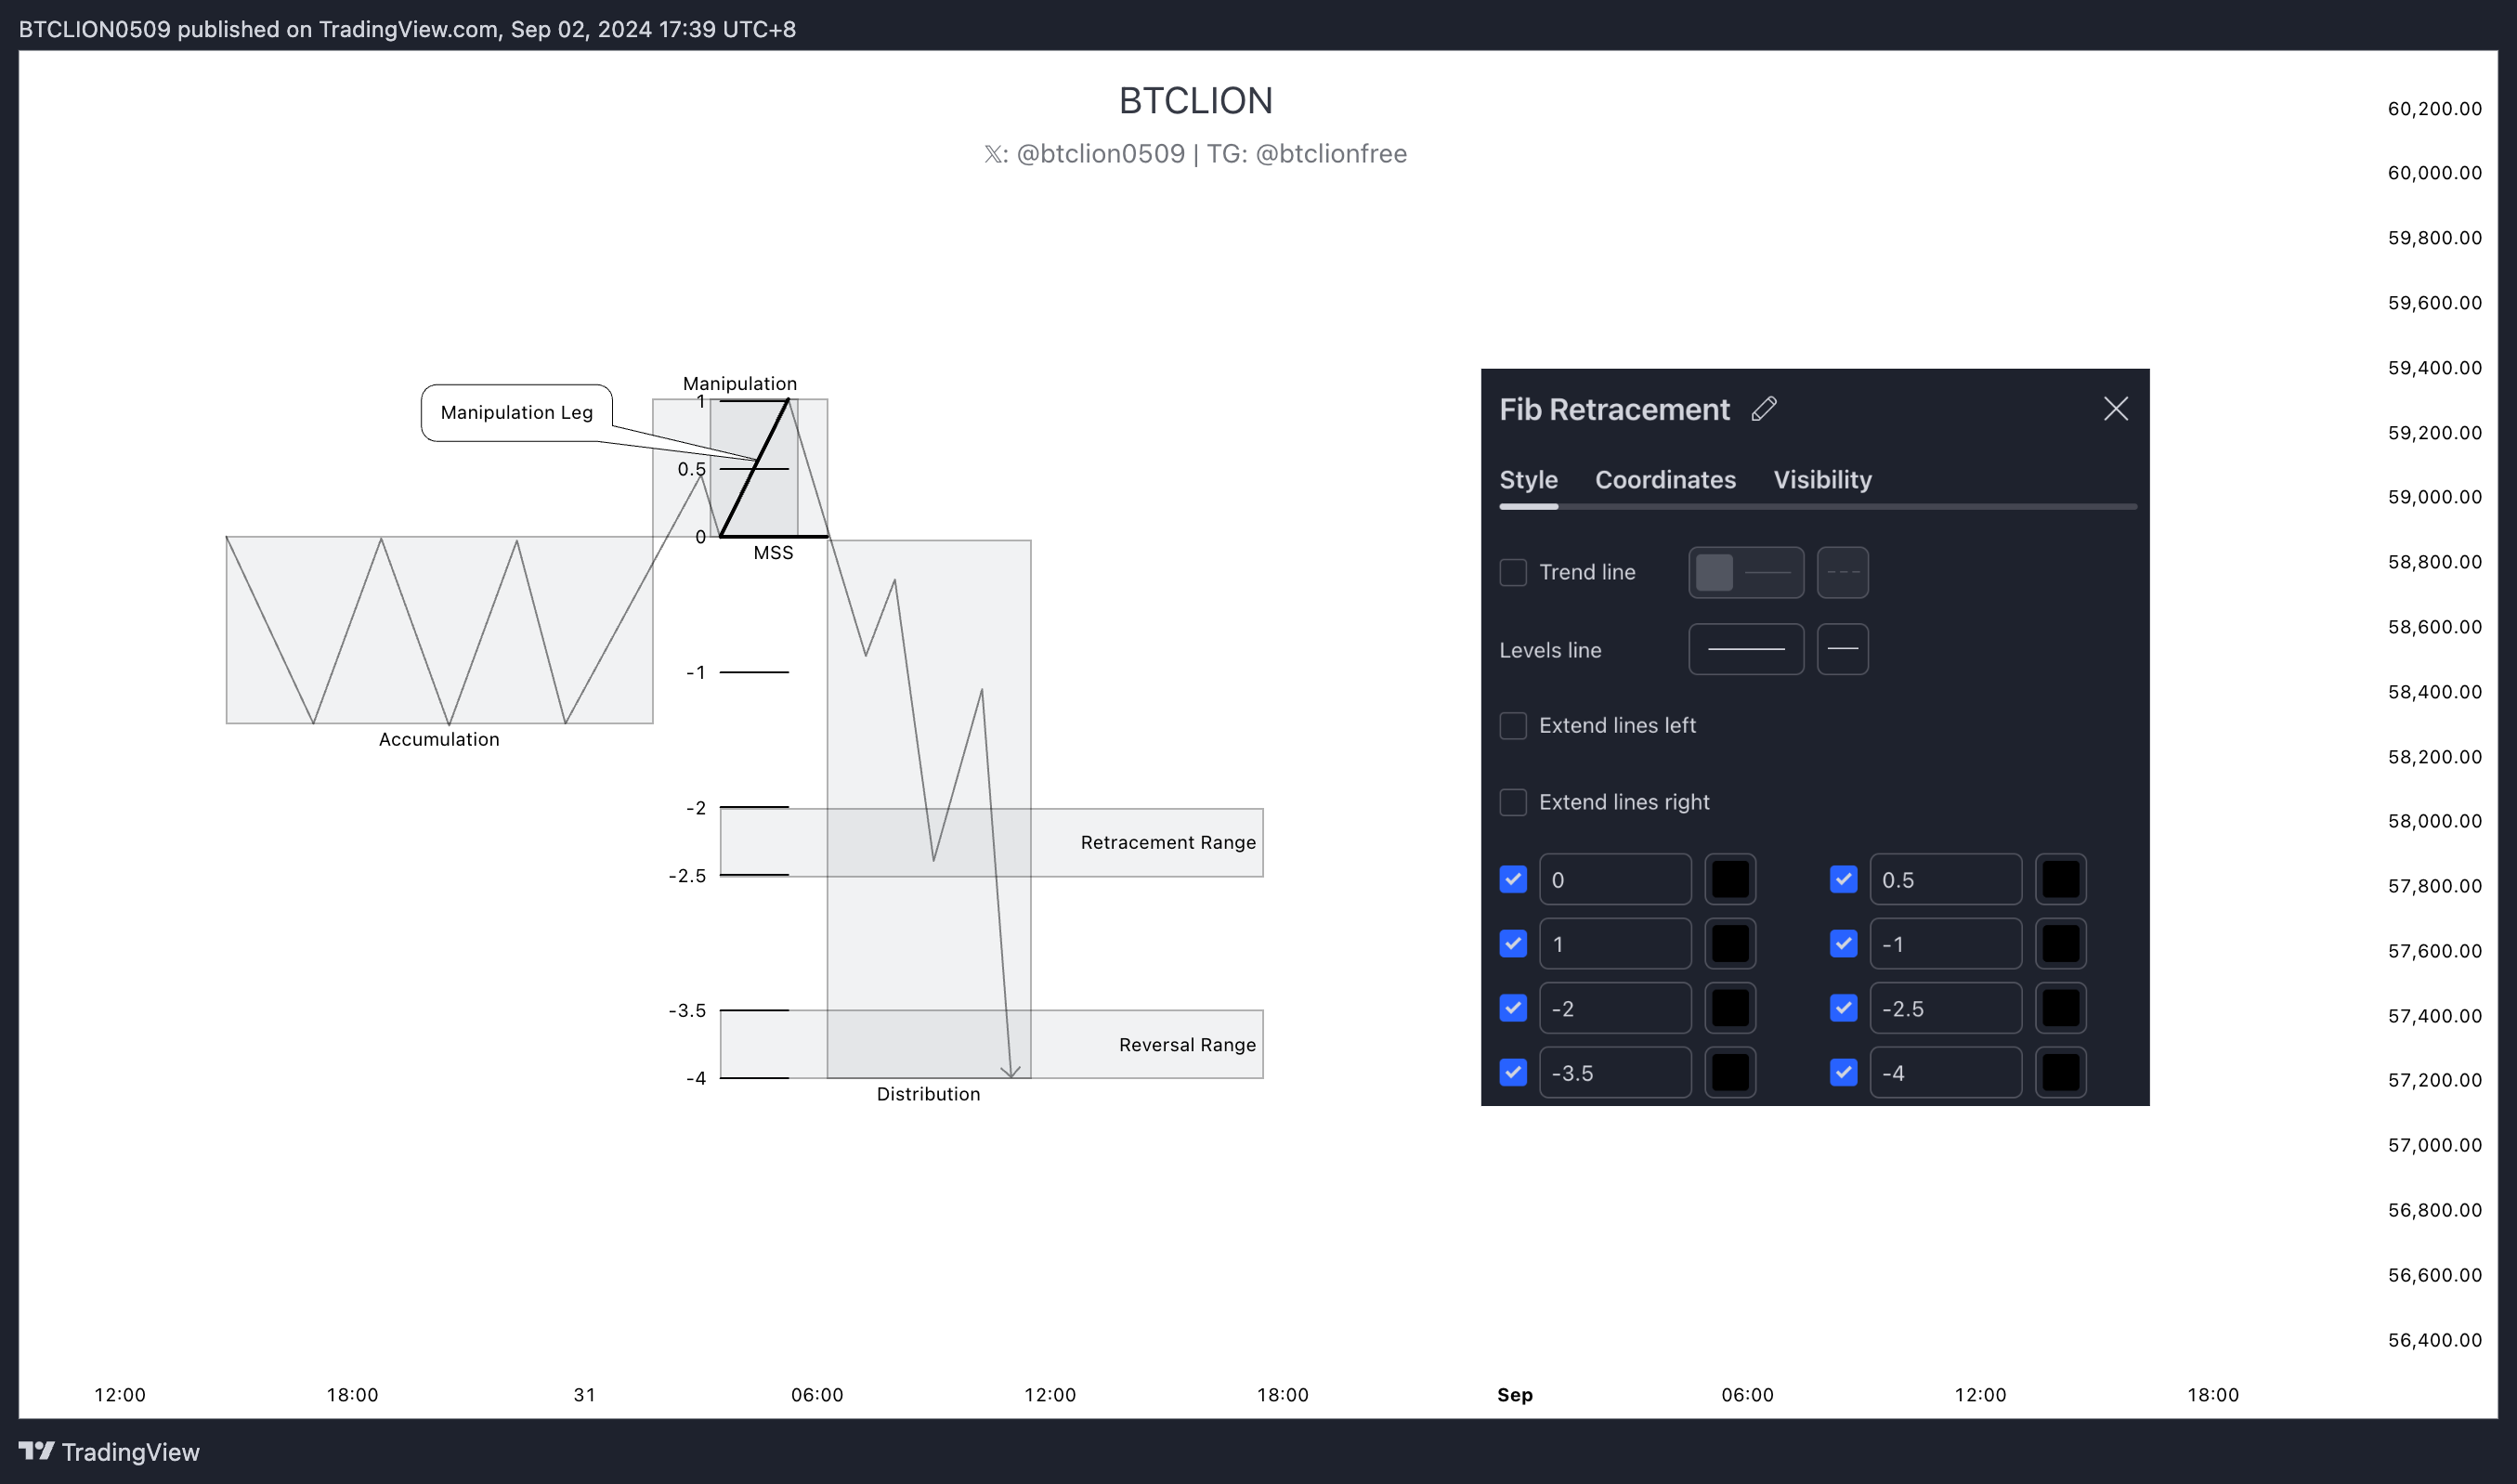
Manipulation Leg
-
0: the start of the Manipulation Leg.
-
0.5: the EQ of the Manipulation Leg.
-
1: the end of the Manipulation Leg.
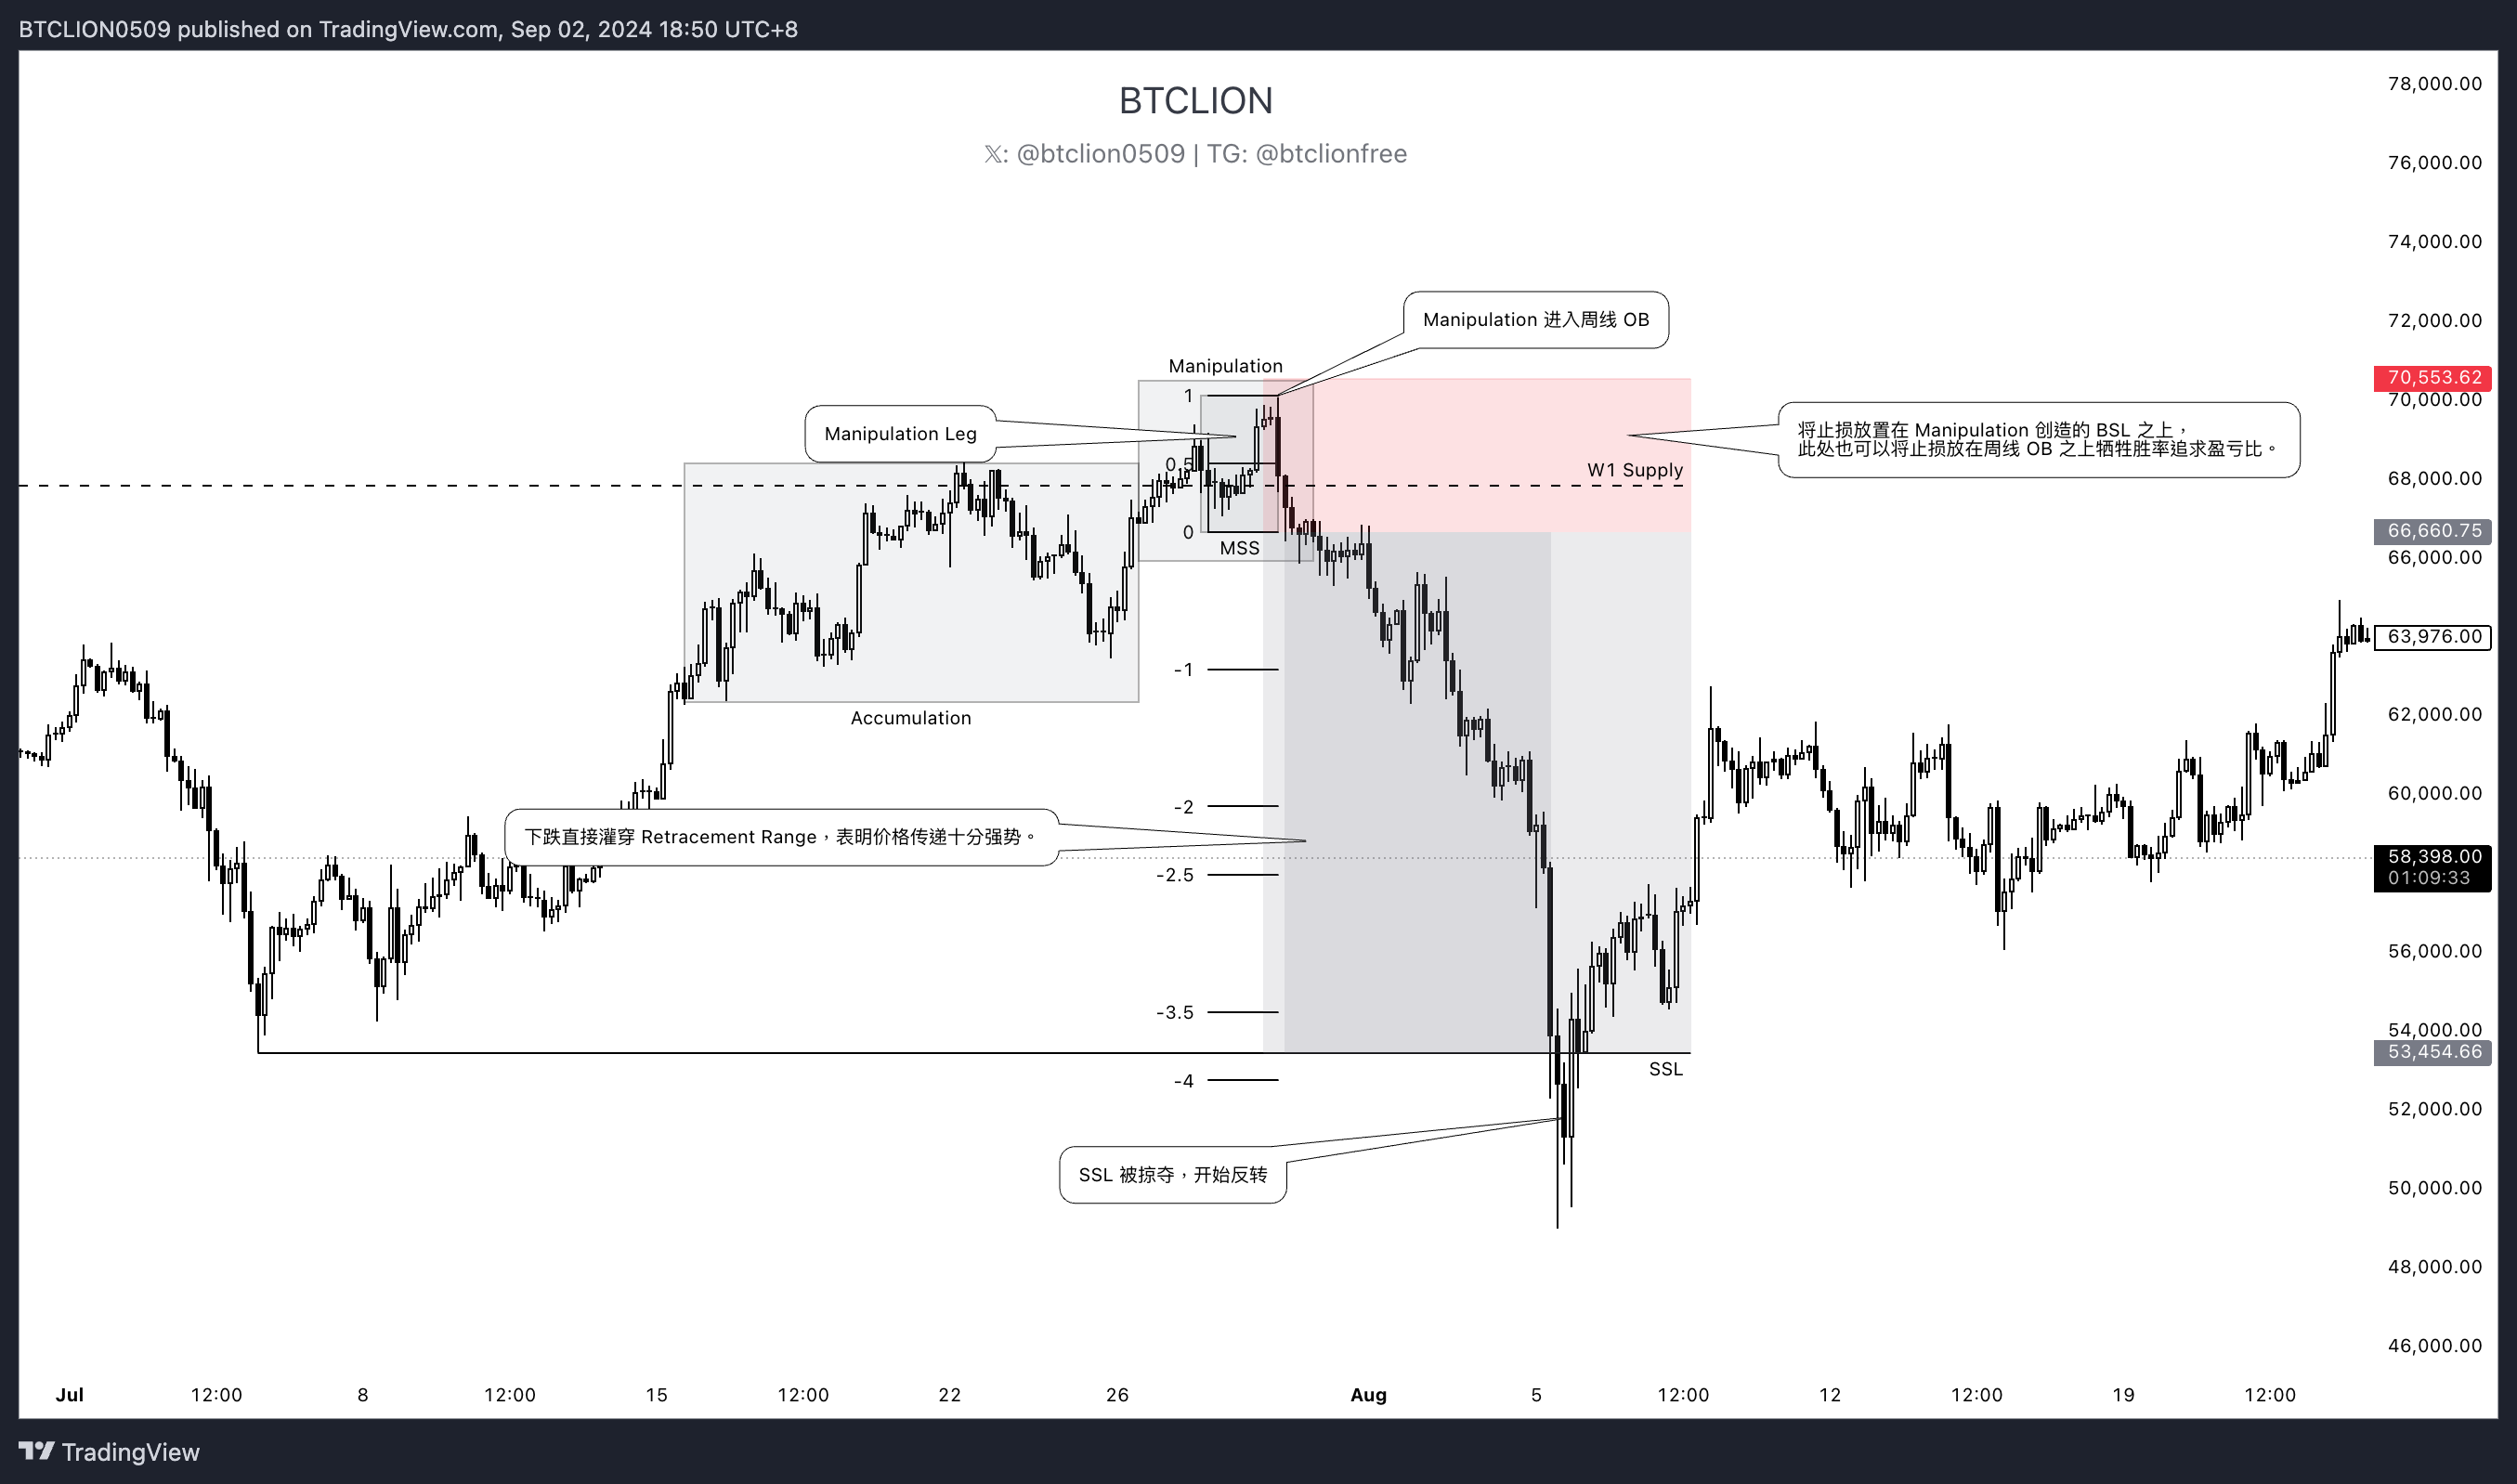
A valid Manipulation Leg should take your HTF DOL. When you judge that Manipulation has ended and the algorithm is about to begin Distribution, this is when you look for the PDA created during the Manipulation Phase and attempt a Turtle Soup.
As mentioned when we explained IPDA, when price shifts from Consolidation into Expansion, we want to enter at the EQ of the Consolidation. Therefore, the most ideal PO3 entry is to find a PDA around the EQ of the Manipulation Leg. However, when PO3 completes Manipulation, price often expands very quickly, so you do not need to force a 0.5 entry every time.
Distribution Phase
-
-1: the 1:1 extension of the Manipulation Leg.
-
-2 ~ -2.5 (Retracement Range): the Retracement Range of price delivery. When price delivers into this area, there is a high probability of retracement. If delivery is not strong enough, price may even reverse directly from this area. Therefore, when trading PO3, you should consider looking for PDAs here to take partial profit, or at least set protective stops or hedges. If price does not reverse in this range, it indicates that price delivery is very strong.
-
-3.5 ~ -4 (Reversal Range): the Reversal Range of price delivery. When price delivers into this area, there is a high probability of reversal. You should consider looking for PDAs here to exit all positions. If price breaks through this range, then the later move no longer has much to do with the PO3 you identified. It may be caused by Distribution on a higher timeframe, which prevents price delivery from reversing here.
STDV Entry Steps
- Identify the Manipulation Leg. Enter when price reclaims it with Turtle Soup, or look for a PDA created during Manipulation. Ideally, the entry is around EQ, but if that is not available, do not force it.
- Draw STDV and look for PDAs around -2 ~ -2.5 to take partial profit or exit fully.
- If price reaches a PDA around -3.5 ~ -4, it is best to exit fully.
Trade Example
OHLC & OLHC
In reality, every candle is a complete PO3 structure on the LTF, although it may not always provide a good trading opportunity. This is the concept of fractals.
- When a candle first raids above the open to create the high, then distributes downward to create the low, we can call that structure OHLC (Open/High/Low/Close).
- When a candle first raids below the open to create the low, then distributes upward to create the high, we can call that structure OLHC (Open/Low/High/Close).
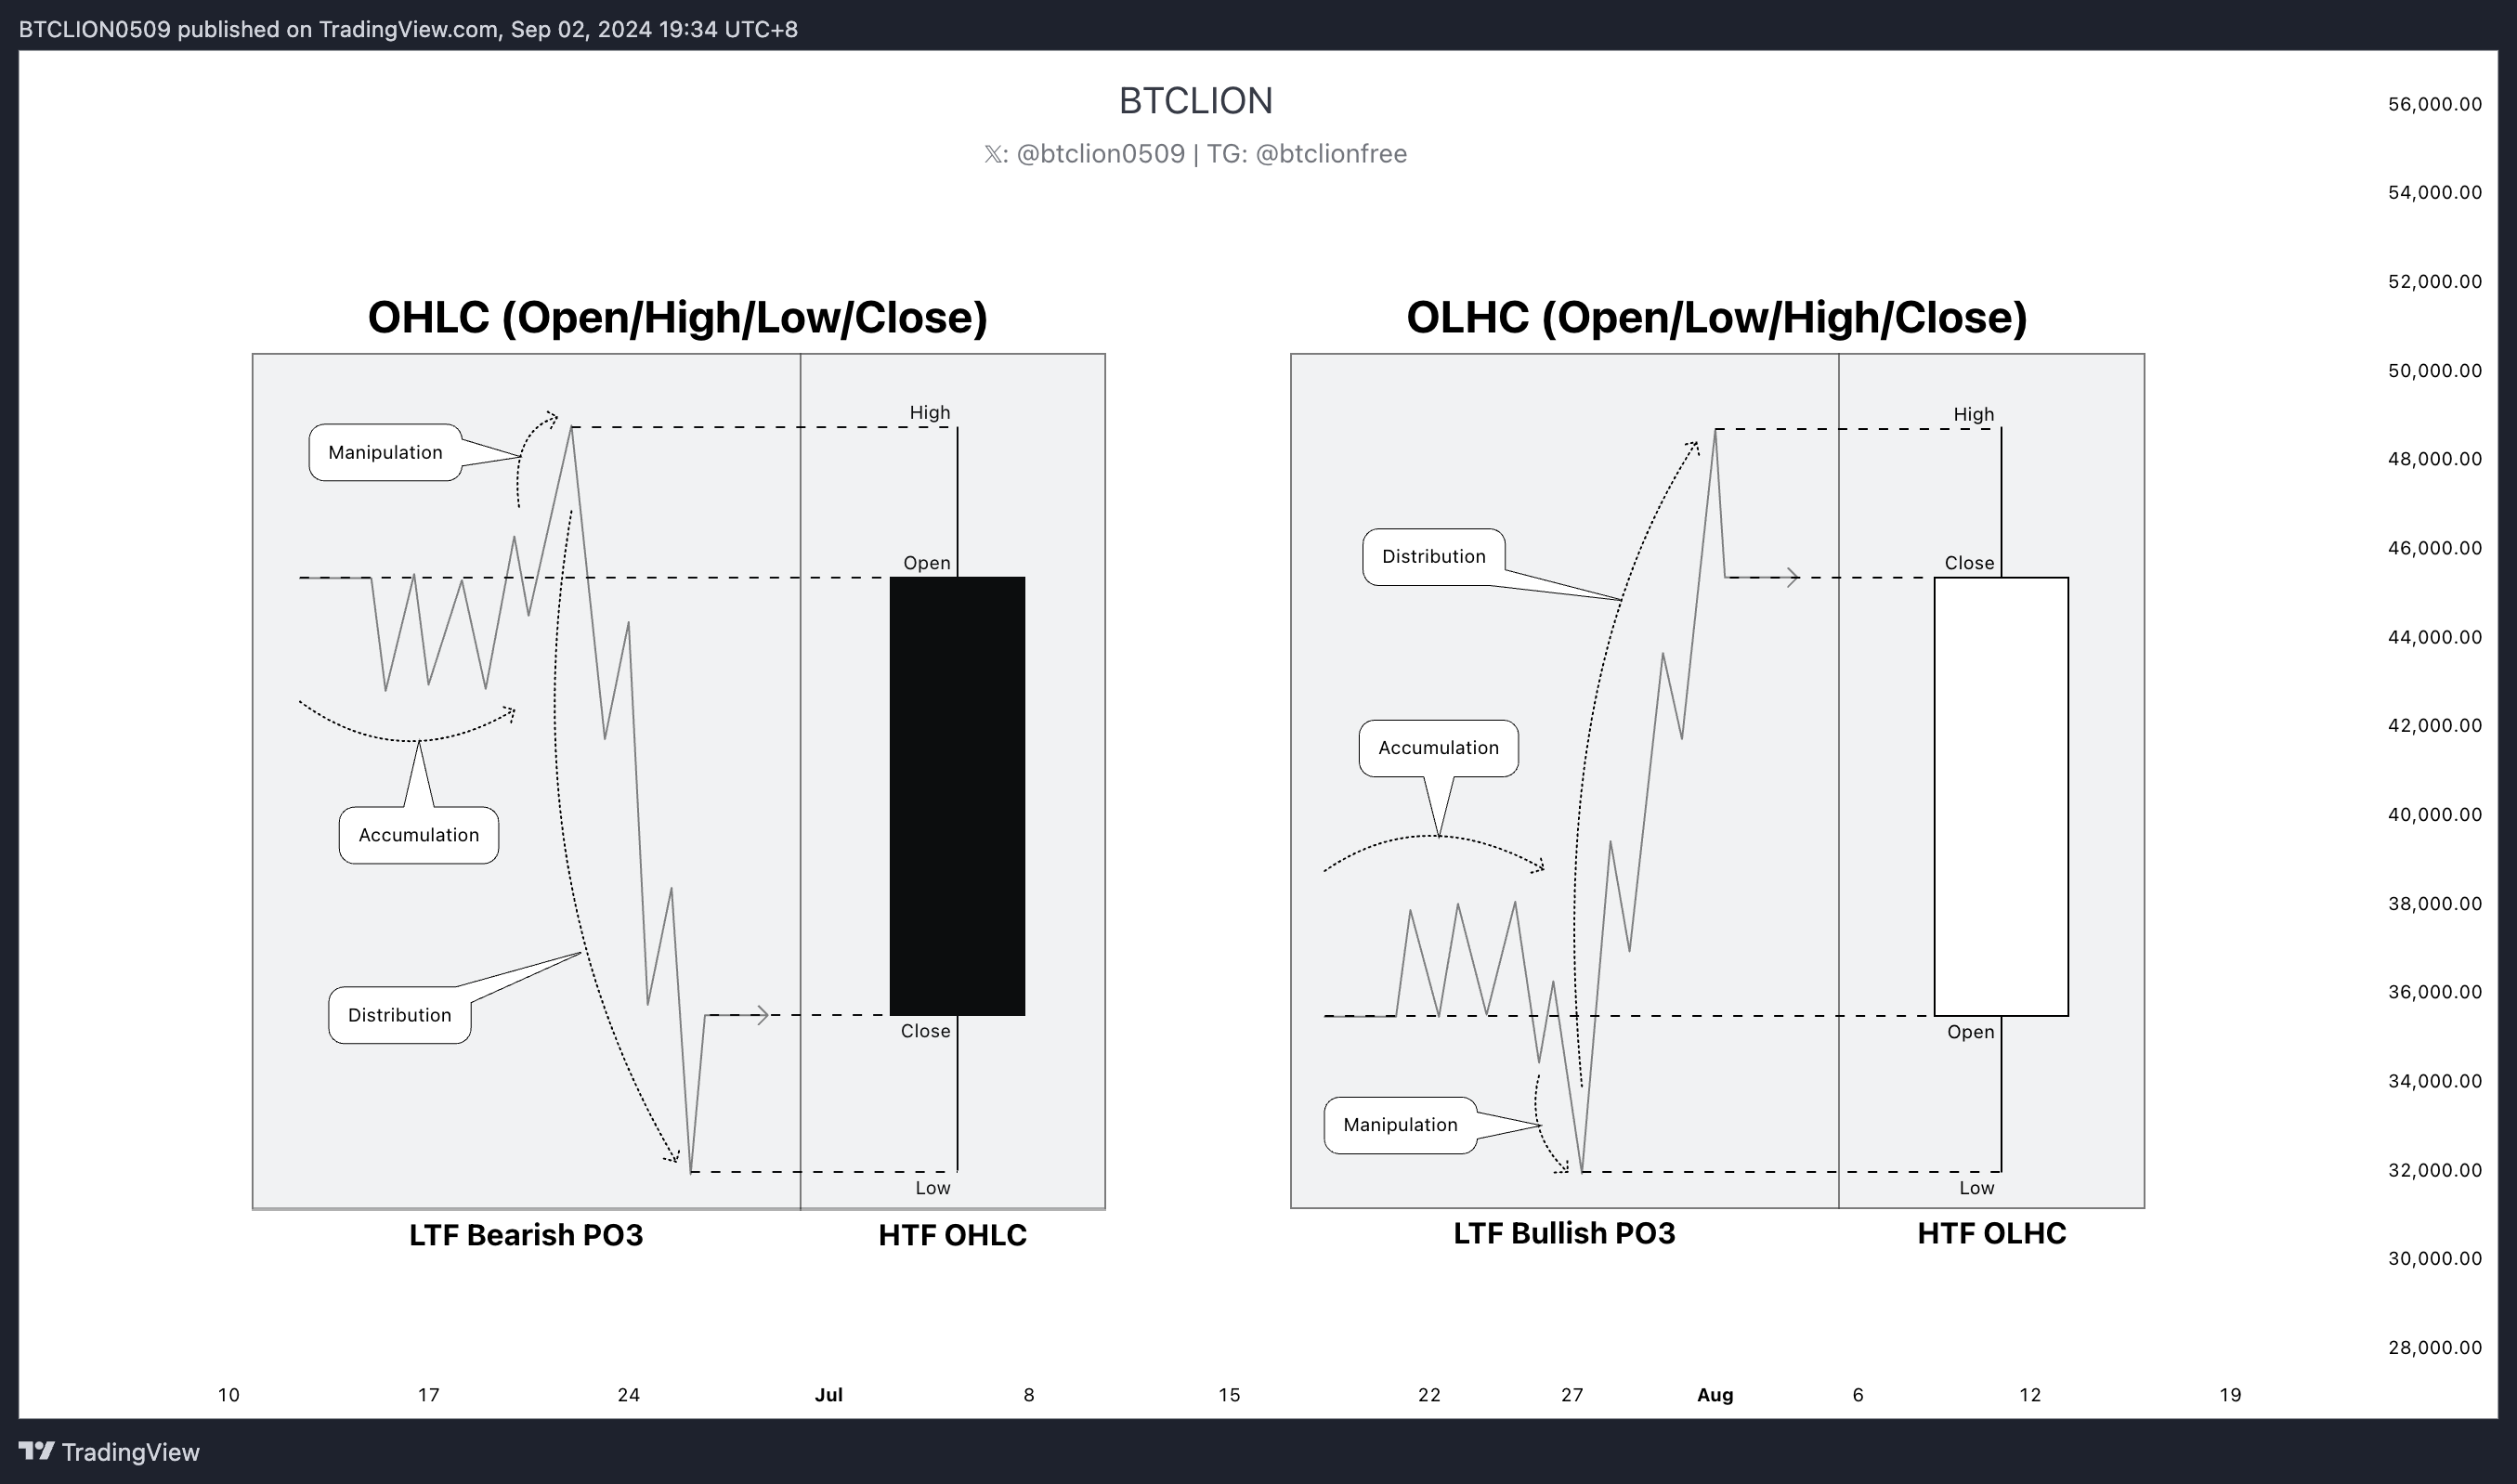
- Therefore, when you trade PO3, from the HTF perspective you are actually entering at the wick. If you successfully exit when Distribution completes, your exit will be located at the wick on the other side.
- Combining this idea, you will realize that "Bias" is not only about whether you think the next swing will go up or down. Your Bias actually means whether you think the next HTF candle should close as a bearish candlestick or a bullish candlestick. Your DOL means where you think the wick of the next HTF candle should reach.
- This is why we first discussed Top-Down Analysis at the beginning of this chapter. Correctly applying HTF, LTF, fractals, and related concepts will make your trading system more complete. If you do not think about what is happening on the HTF while trading, your view can easily become limited by current-timeframe structure. Price may be retracing on the HTF, but you may mistakenly treat it as a reversal on the LTF and miss the later HTF trend continuation.
Daily PO3
From the beginning, we have known that ICT/SMC is essentially about trading based on liquidity, or Liquidity Trading. During a single day, different trading sessions have different liquidity conditions. This is also why ICT/SMC is most commonly applied to intraday trading and lower. We can profit from liquidity shifts throughout the day. In intraday trading, we go through three trading sessions, and together these three sessions form a full daily PO3.
Asia Session
- Corresponds to the day's Accumulation.
- Mainly driven by institutions in Hong Kong, Tokyo, and nearby regions.
- Session: 08:00 ~ 14:00 (UTC+8)
- Asia Killzone: 08:00 ~ 10:00 (UTC+8)
- Usually, we do not want to trade during Asia Session. Instead, we watch the Accumulation range built during this period, known as the Asia Range, and observe how that range is raided later.
London Session
- Corresponds to the day's Manipulation.
- Mainly driven by European institutions led by London.
- Session:
- Daylight saving time: 15:00 ~ 23:00 (UTC+8).
- Standard time: 16:00 ~ 24:00 (UTC+8).
- London Open Killzone:
- Daylight saving time: 15:00 ~ 18:00 (UTC+8).
- Standard time: 16:00 ~ 19:00 (UTC+8).
- London Close Killzone:
- Daylight saving time: 21:00 ~ 23:00 (UTC+8).
- Standard time: 21:00 ~ 23:00 (UTC+8).
- During London Session, we watch how Asia Range liquidity is raided. Usually, when time moves from Asia Session into London Session, volatility begins to increase. London Killzone refers to the two hours after the open and the two hours before the close. During these periods, volume tends to peak, liquidity is sufficient, and the high or low of the day is often created.
- London Session is full of fake moves, also known as Judas Swing. Based on my experience, trades taken during London should generally be more conservative.
New York Session
- Corresponds to the day's Distribution.
- Mainly driven by American institutions led by Wall Street.
- Session:
- Daylight saving time: 21:30 ~ 04:00 (UTC+8).
- Standard time: 22:30 ~ 05:00 (UTC+8).
- New York Killzone:
- Daylight saving time: 21:30 ~ 23:30 (UTC+8).
- Standard time: 22:30 ~ 00:30 (UTC+8).
- Wall Street controls the largest pool of capital in the world, so New York Session is the peak of daily volume and liquidity. Usually, after New York Session has completed London Manipulation, it pushes price into one-directional delivery, completes the day's Distribution target, and creates the daily high or daily low.
- The job of New York Session is to complete the day's Distribution. Based on my experience, if you get an excellent entry during London Session or New York Killzone, you can try to take your final profit during this period.
For Daily PO3, having the concept is enough. London Session and New York Session are indeed the most suitable trading sessions during the day, but in my view, crypto's timezone behavior is extremely messy. Sometimes you will see Asia Range go directly into Expansion and then consolidate for the rest of the day. This section is mainly meant to give you more session-based confluence when entering trades, helping you build confidence and complete your trading thought process. Do not simply assume that this section alone allows you to find the best entry in London every day and hold it all the way to the New York Distribution high or low.
Market Maker Model (MMXM)
The Market Maker Model refers to the basic operating structure of how the Market Maker executes price delivery. Based on buying and selling, it can be divided into the Market Maker Buy Model (MMBM) and the Market Maker Sell Model (MMSM). Together, MMBM and MMSM are collectively called MMXM.
MMXM is built mainly around two key ideas:
- ERL & IRL: price only delivers between ERL (Liquidity) and IRL (OB / FVG).
- PO3: price delivery goes through the three phases of Accumulation / Manipulation / Distribution.
Make sure you fully understand these two points. If you do not understand them yet, go back and review. If you still cannot understand them, just come ask me directly.
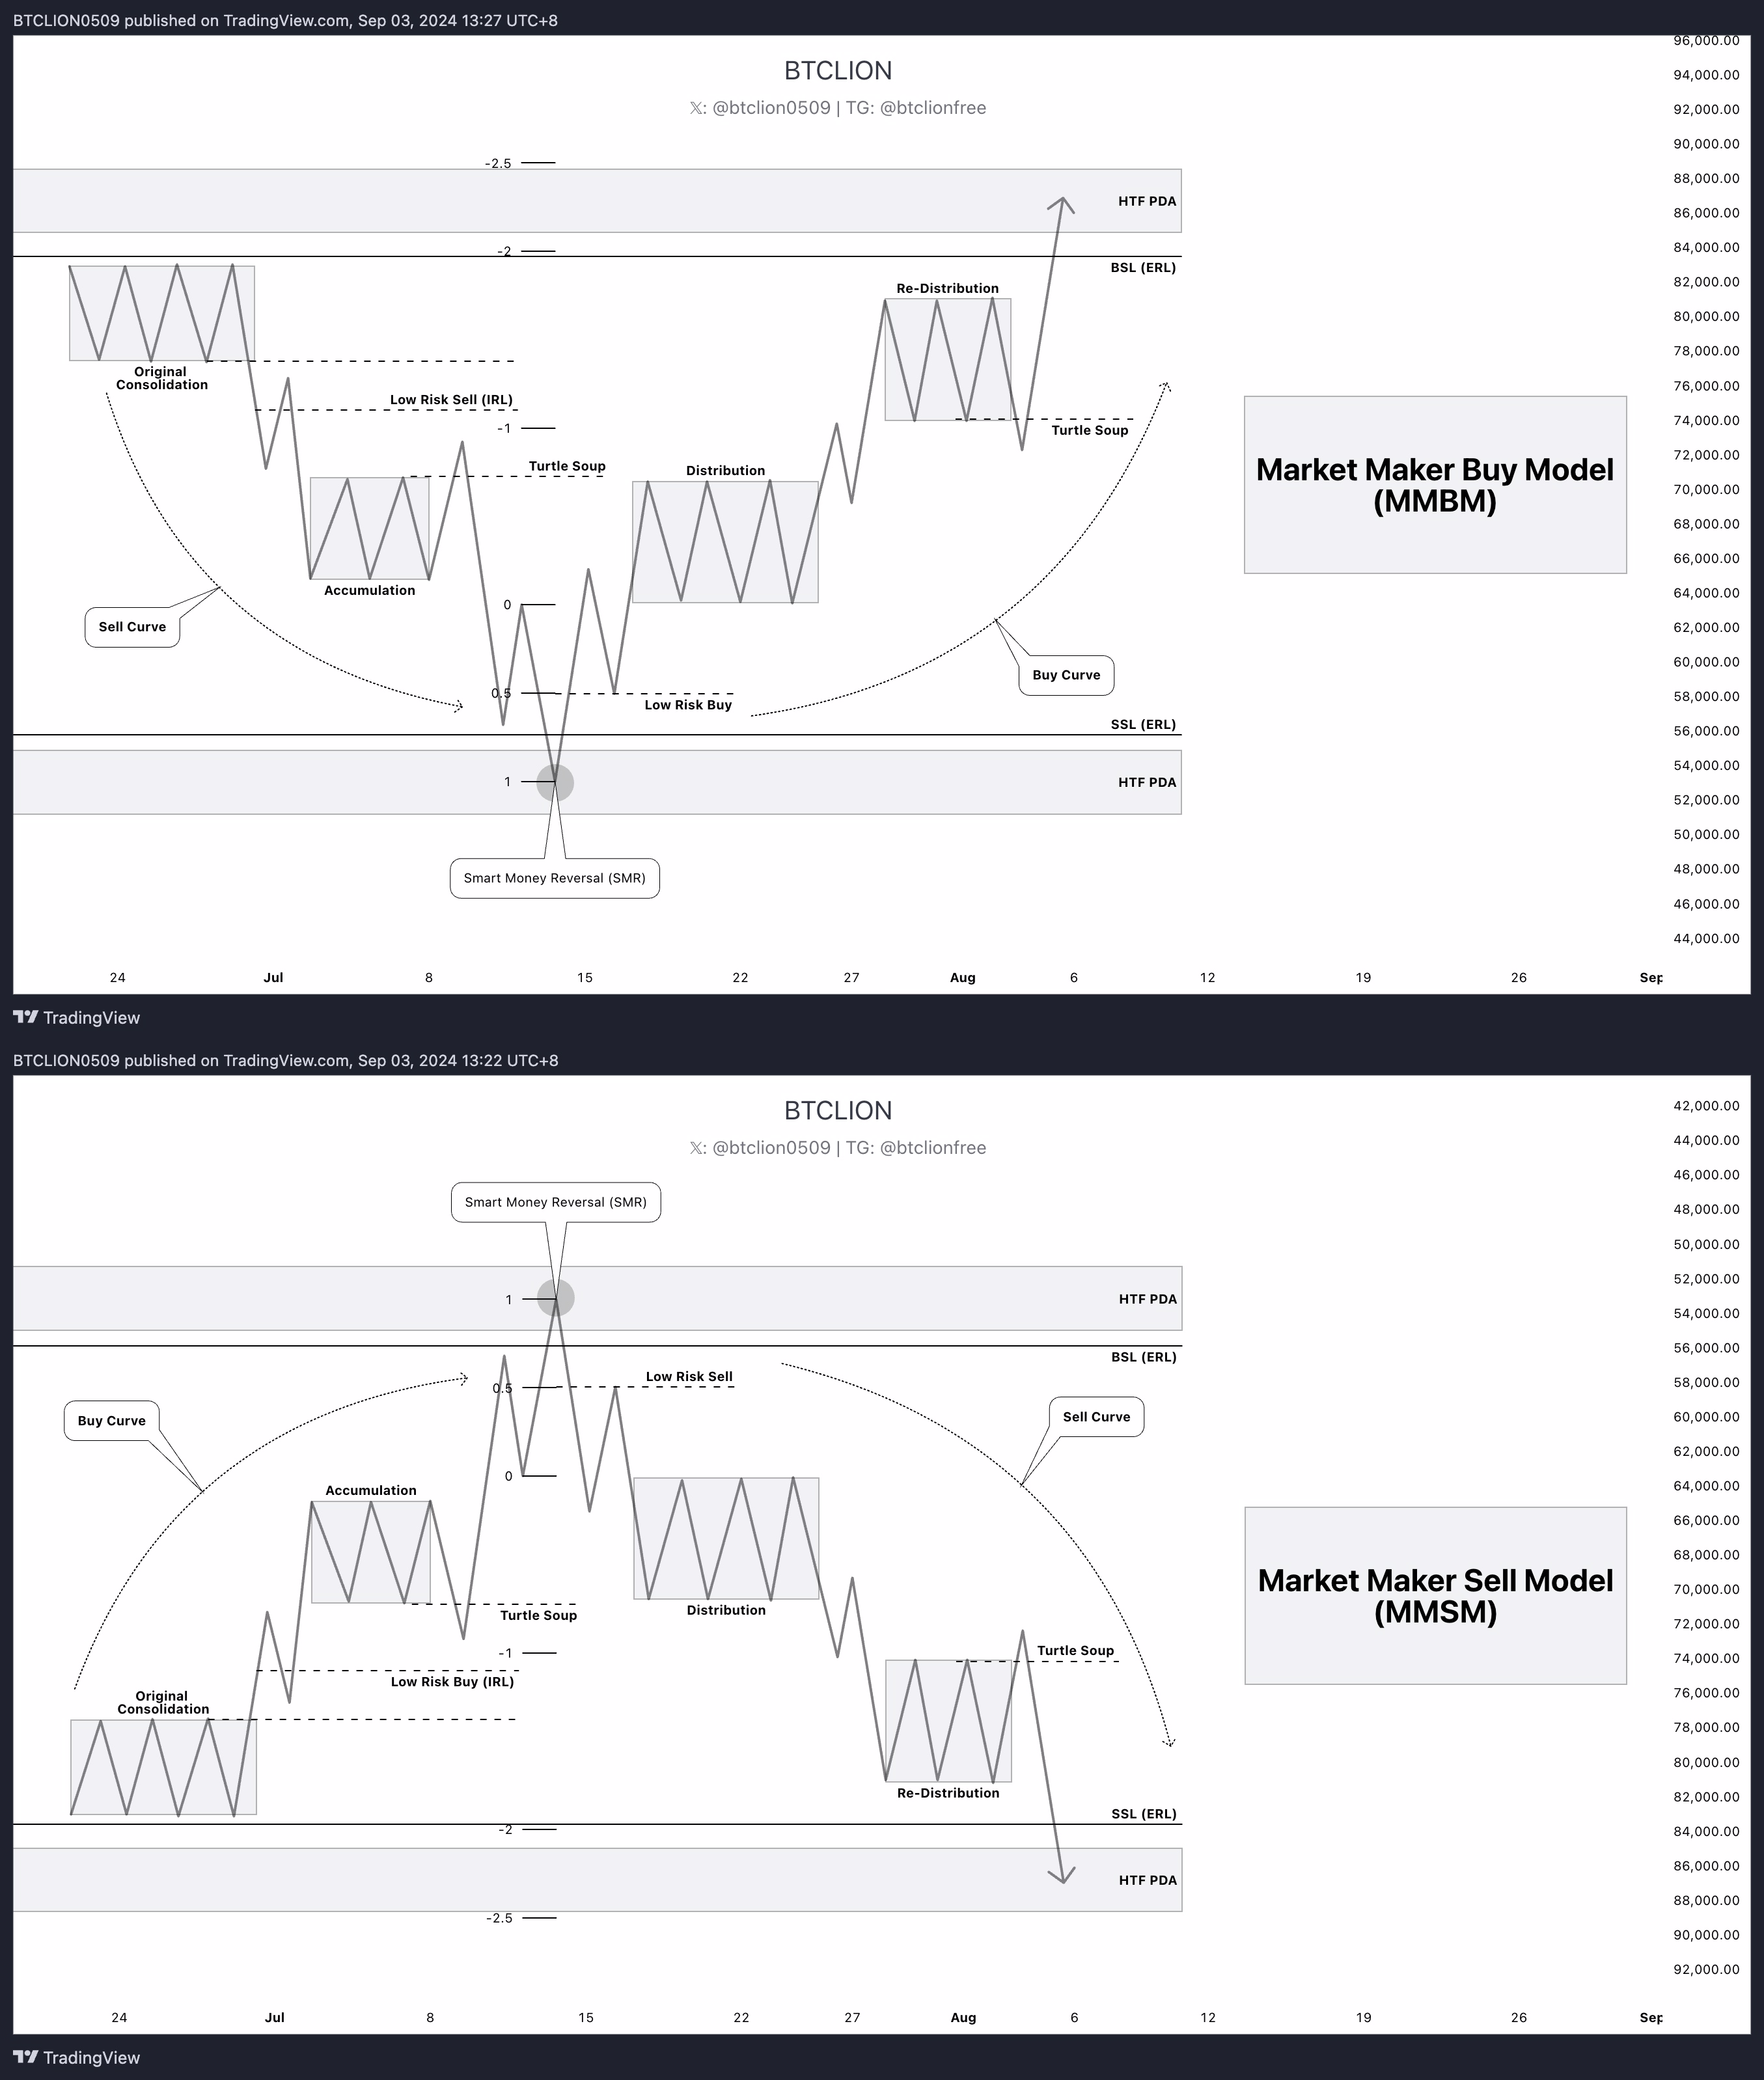
- Original Consolidation: as mentioned in IPDA, all price delivery begins from Consolidation.
- Low Risk Buy (LRB), Low Risk Sell (LRS): trade opportunities provided at the initial stage of price delivery reversal, after higher-timeframe liquidity has been taken. Participating here can provide an excellent risk-to-reward ratio.
- Accumulation: the accumulation phase in PO3.
- Smart Money Reversal (SMR): the behavior where lower-timeframe price delivery reaches the higher timeframe, takes higher-timeframe liquidity, and then reverses.
- Distribution: the first distribution that occurs after SMR as price delivers toward the higher-timeframe ERL. This mainly distributes the profit-taking inventory from the LRS/LRB after SMR.
- Re-Distribution: distributes the remaining inventory from the first Distribution and delivers price into the STDV 2~2.5 area, forming a complete PO3.
MMXM has no fixed form. The MMXM shown in the chart is only an illustration. MMXM describes how HTF IRL to ERL appears on the LTF. Every HTF IRL to ERL is an LTF MMXM. The core idea is that all lower-timeframe price action serves the higher timeframe. When lower-timeframe price runs into a higher-timeframe PDA, all lower-timeframe price delivery will reverse and become higher-timeframe liquidity.